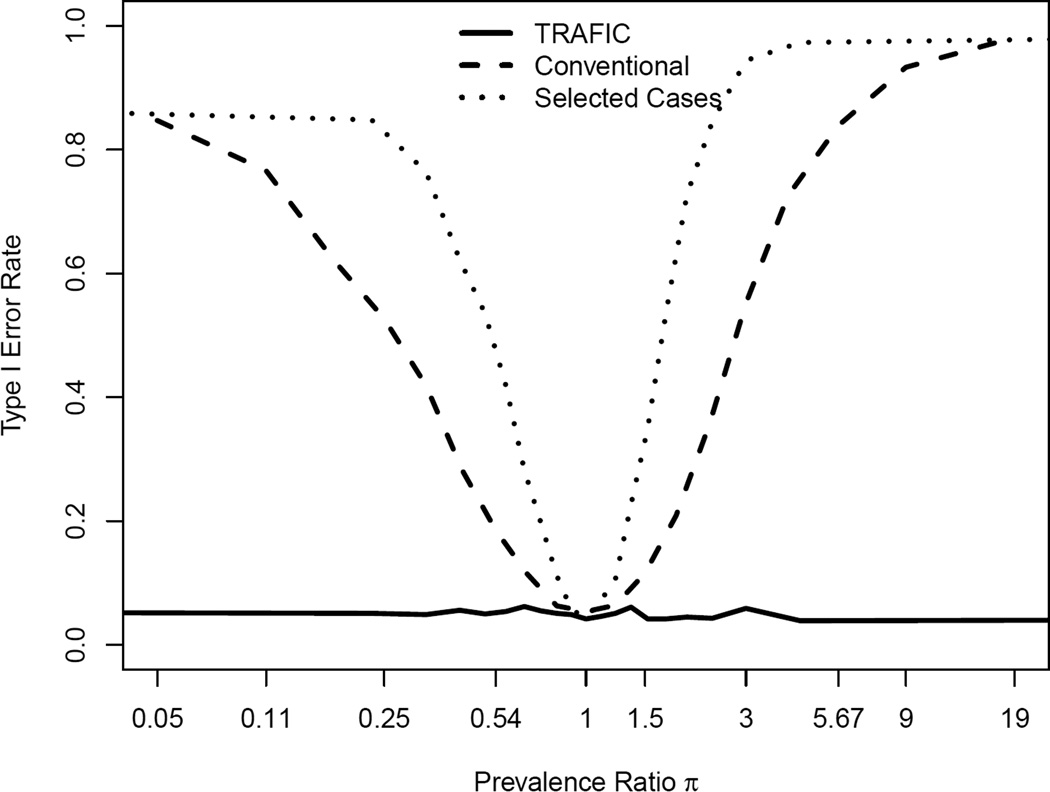
Figure 4.
False positive rate in the presence for population stratification for TRAFIC, selected cases and the conventional case-control design. The false positive rate is shown as a function of the prevalence ratio π between two sampled populations. Calculations are based on a summed allele frequency of 0.01 in population 1 and 0.05 in population 2, and a sample size of 2000 individuals (1000 sibpairs or 1000 cases and 1000 controls) at a significance level 0.05.

