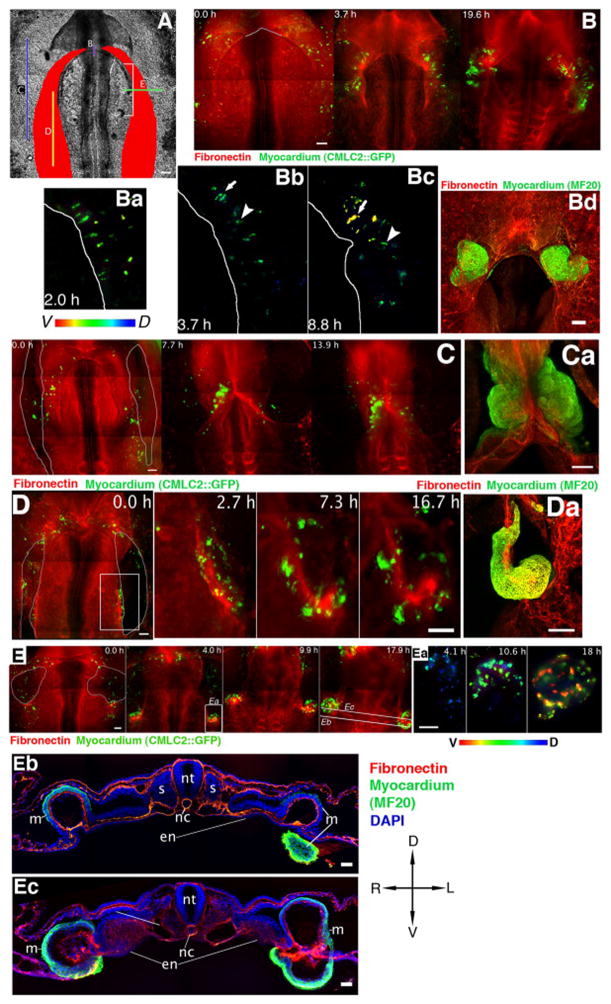
Figure 4. Typical phenotypes induced by localized incisions through the endoderm and splanchnic mesoderm of HH8 embryos.
A – location of incisions (labeled B–E) that result in phenotypes shown in panels B–E. Myocardial fields are schematically represented by red shading. B, C, D, E: Time-lapse image sequences of perturbed myocardial development. Red – B3D6 mAb-labeled fibronectin ECM, green – CMLC2::GFP or CMLC2::mitoRFP-expressing myocardial cells. Contour lines delineate the wound edges at the onset of recording, 0.5–1.5 hours post-incision. Time elapsed during recording is indicated on image panels. Scale bars: 100 μm unless otherwise indicated. Bd, Ca, Da: Myocardium visualized at the recording conclusion by post-fixation MF20 antibody labeling (green) and confocal imaging. B – An incision through the endoderm at the ventral midline leads to the failure of midline fusion and formation of two lateral “hearts” (cardia bifida). Ba-Bc – Images of the left myocardial field of a CMLC2::GFP-transfected embryo that underwent an incision through the endoderm at the ventral midline. Color-code indicates dorso-ventral position of the labeled cells. Contour lines illustrate the position of the AIP edge. The same cell groups are indicated by an arrow and an arrowhead. Note the elongated shapes of CMLC2::GFP-expressing cells in Bc, a contraction comparable to Fig. 2. Myocardial cells become increasingly ventral, as indicated by the change in color from blue/green to yellow/red. C – Bilateral incisions through the endoderm and the underlying splanchnic mesoderm lateral to the myocardial fields have minor effects on heart development and are compatible with myocardial fusion. D – Bilateral, longitudinal incisions through the myocardial fields and endoderm. The region marked by the white rectangle on the left panel is shown in detail in the adjacent panels. E – Bilateral, medio-lateral incisions, perpendicular to the AIP arch, through the endoderm and underlying myocardium and splanchnic mesoderm. Embryos shown are representative examples. The number of embryos that underwent the various types of surgical perturbations are as follows: n=15 (Fig. 4B), n=6 (Figs. 4C and 4D) and n=34 (Fig. 4E). Ea: Cellular resolution image sequence depicting CMLC2::GFP-expressing myocardial tissue curling ventrally at the wound edge, within the area marked by a white rectangle in panel E. The color code represents dorsal-ventral position. Eb and Ec are images of transverse sections taken post-fixation at the lines indicated in panel E. Note that the myocardium forms pronounced cup-like structures posterior to the incision site (Eb), whereas the endoderm remains relatively planar. At the incision site (Ec), deformed (“curled”) myocardium is found ventral to the endoderm. En – endoderm, mc – myocardium, nc – notochord, nt – neural tube, s – somite; D – dorsal, V - ventral, L – left, R – right. Scale bars in Eb and Ec: 50 μm.

