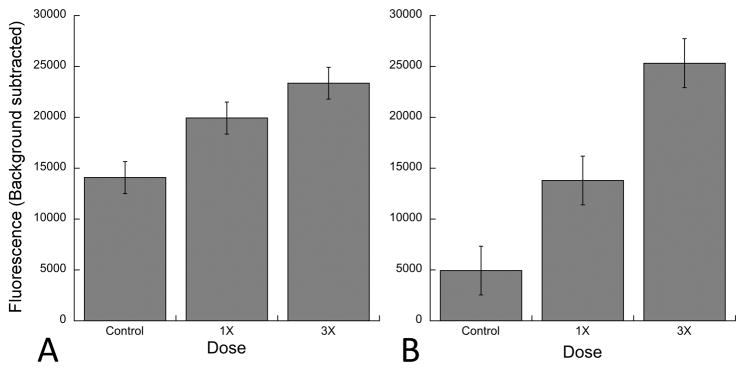
Fig. 3. Quantification of fluorescence following systemic 6-FAM-ZOL treatment.

Measurements are shown for cochleae (A) and tibeae (B). For cochleae, measurements were taken at each of six cochlear half-turns from base to apex and averaged. The data summarize three independent experiments for tibiae and seven independent experiments for cochleae. Statistical significance was measured using ANOVA. For the lateral wall, the p values between control and 1X, control and 3X, and 1X and 3X were 0.016, <0.0001, and 0.0352 respectively.
