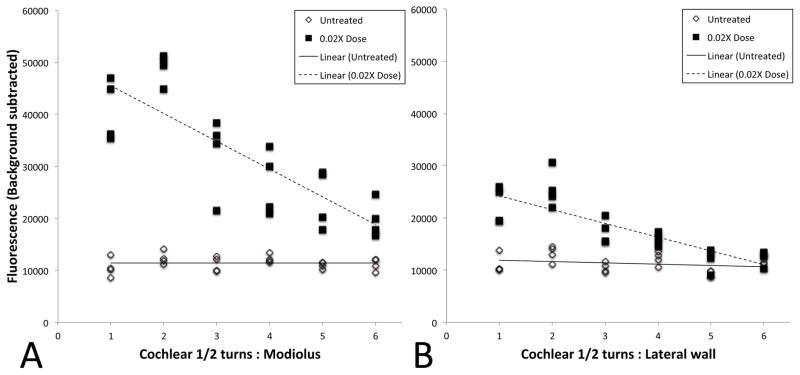
Fig. 7. Quantification of fluorescence following cochlear infusion of 6-FAM-ZOL.
Measurements were taken at each of six cochlear half-turns from base to apex, along both the modiolus (A) and lateral wall (B). Data points from all experiments are shown, along with the best-fit regression plot. Total average fluorescence was significantly greater in 0.02X for both the modiolus (p=0.0031), the lateral wall (p=0.0124). The slope of the 0.02X regression plot was significantly different from the control for both the modiolus (p=0.0003) and the lateral wall (p=0.0007).

