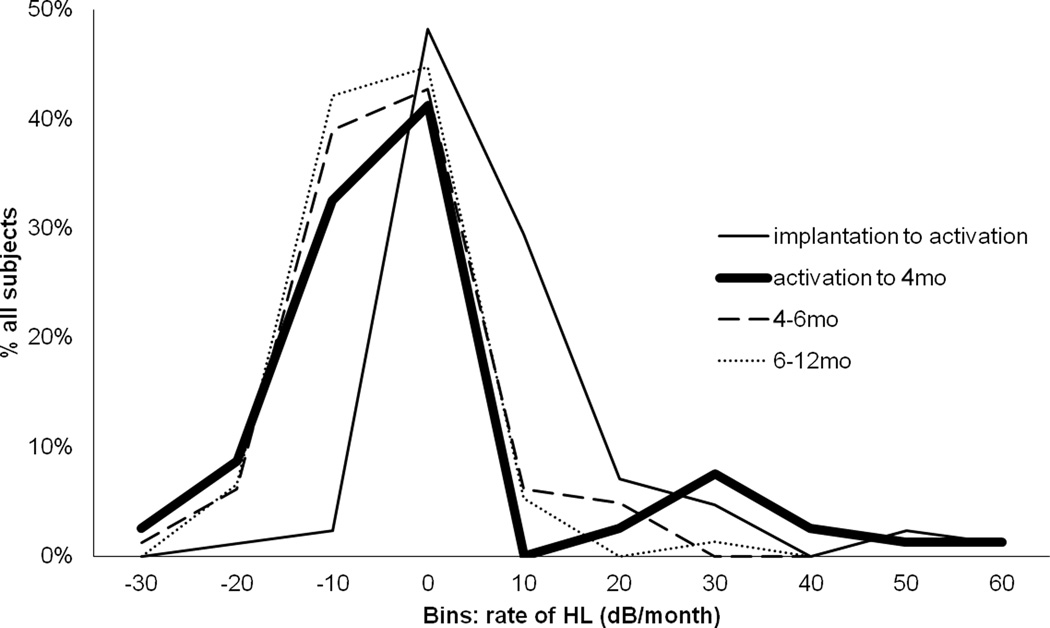
Figure 4.
A small subset of patients had high rates of HL after activation. A frequency histogram of rate of HL shows that the majority of patients had rapid loss between implantation and activation (~1 month post-operatively). For most of these patients rate of HL then decreased or plateau-ed. The bold line depicts rate of HL from activation to 4 months post-operatively - at the onset of ES. Here we see a bimodal distribution in that a small proportion of patients had an increase in HL rate at this time.

