
Fig. 1.
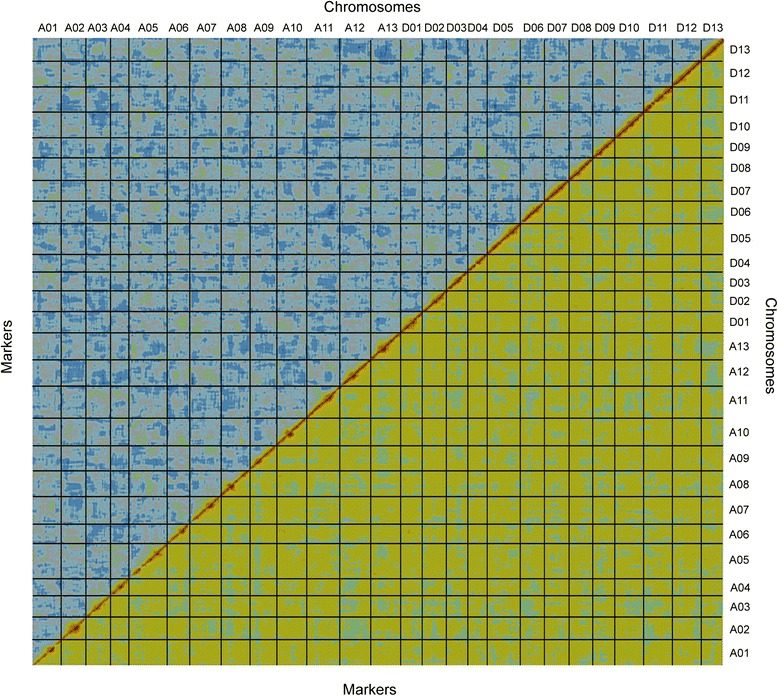
Graphical representation of the high-quality linkage map of tetraploid cotton. Alignment of 4,049 bins along the 26 chromosomes reveals a pairwise BIT score (top-left diagonal) and REC score (low-right diagonal) in all pairs of marker bins, plotted here using CheckMatrix [82]. Red represents tight linkage; yellow represents weak linkage; and blue represents no linkage. The red along the diagonal and the lack of red off the diagonal indicate the high quality and strong statistical support of the map