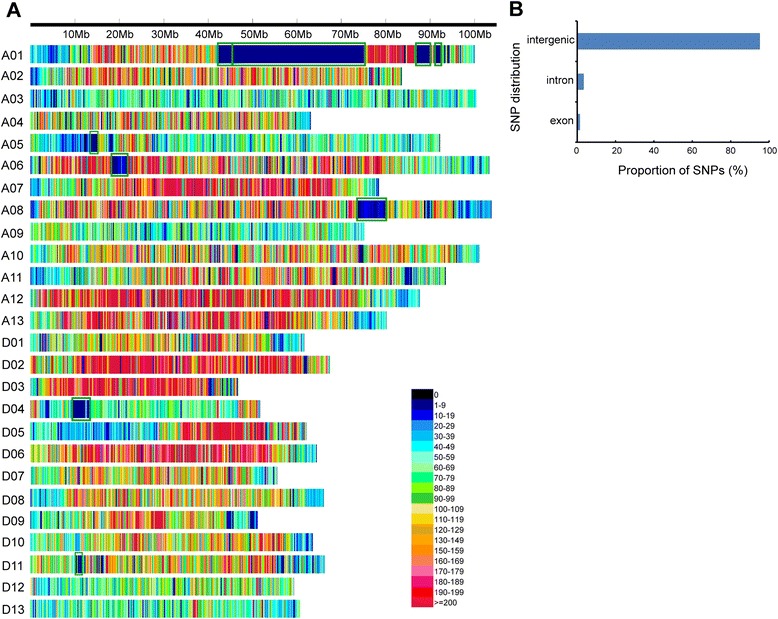
Fig. 3.

SNP distribution in the cotton genome. a Distribution of SNPs in the 26 chromosomes. The x-axis represents the physical distance along each chromosome, split into 50 kb windows. The green rectangles indicate SNP-poor regions. b Proportion of SNPs found in intergenic regions, introns, and exons
