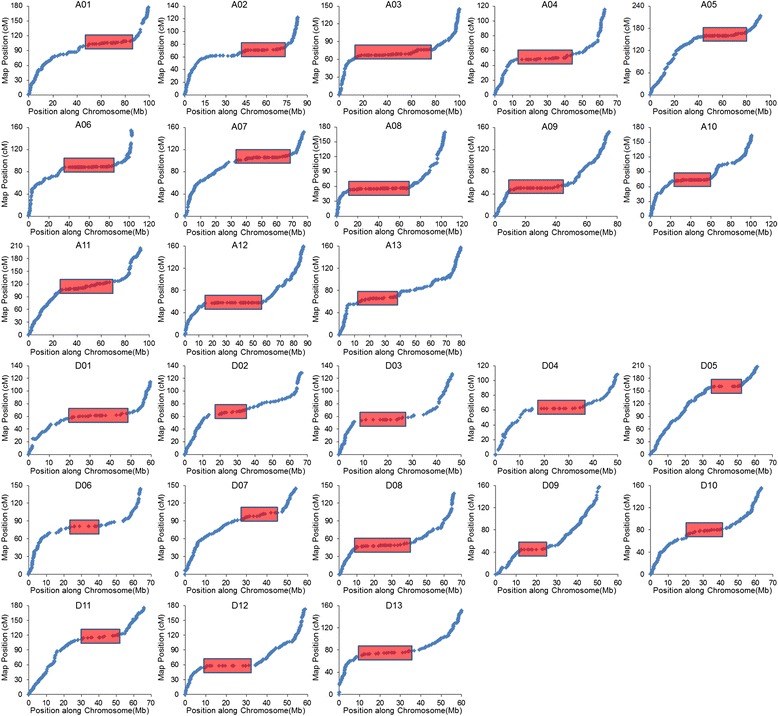
Fig. 5.

The marker placements for the genetic map on the G. hirsutum acc. TM-1 chromosomes. The marker order on the y-axis is derived from the genetic maps and the marker order on the x-axis is derived from the physical maps. Both the relative genetic and physical distances of the chromosomes on the plots are represented by the cells of different sizes according to the ratio of the chromosome lengths. Cumulative genetic distance in cM and physical distance in bp are indicated on x-axis and y-axis, respectively. The red rectangles represent the recombination suppression regions (nearly flat shaded) which are predicted to be pericentromeric regions
