
Fig. 9.
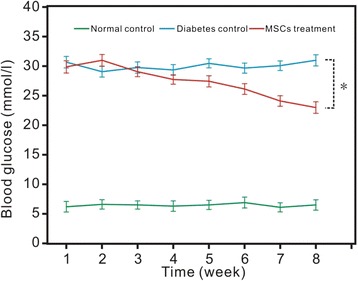
Blood glucose of the three groups for 8 weeks after MSC treatments. We set the time when MSCs were injected as the start of the study. The data, all in triplicate, are shown as the mean ± SD values. *p < 0.05
Official websites use .gov
A
.gov website belongs to an official
government organization in the United States.
Secure .gov websites use HTTPS
A lock (
) or https:// means you've safely
connected to the .gov website. Share sensitive
information only on official, secure websites.
Blood glucose of the three groups for 8 weeks after MSC treatments. We set the time when MSCs were injected as the start of the study. The data, all in triplicate, are shown as the mean ± SD values. *p < 0.05