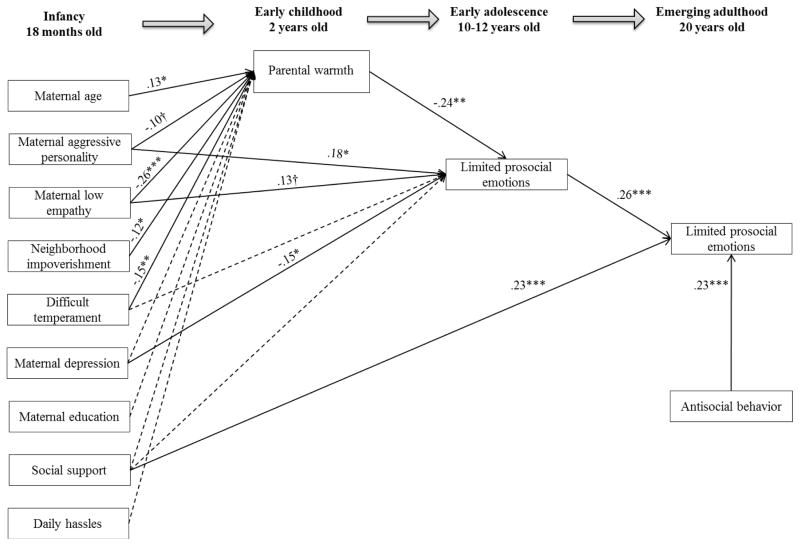
Figure 2. Direct and indirect effects between contextual risk factors, parental warmth, and LPE (ages 10–12 and age 20).
Note: † p < .10, *p <.05; **p<.01; ***p<.001. CI = confidence intervals. For indirect effects, we provide an estimate of the product of the coefficients (αβ), (i.e., the ‘sobel test’) as an index of gross effect size. However, we also present the bootstrapped CI of this effect (p < .10), as bootstrapped results have been shown to be more powerful and accurate and less dependent on the likely non-normal distribution of the product term. Thus, we focus on bootstrapped CI in the Results, but present effect sizes for comparability and ease of interpretation: (a) low empathetic awareness → parental warmth → LPE ages 10–12 (αβ=.06, p=.02; bootstrapped CI =.02, .10); (b) infant difficult temperament → parental warmth → LPE ages 10–12 (β = .04, p = .04; bootstrapped CI =.01, .07); (c) parental warmth → LPE ages 10–12 → LPE age 20 (αβ=.06, p=.02; bootstrapped CI =.02, .10); (d) maternal aggressive personality → LPE ages 10–12 → LPE age 20 (αβ=.05, p=.04; bootstrapped CI =.02, .09); (e) higher maternal depression → LPE ages 10–12 → LPE age 20 (αβ=.04, p=.06; bootstrapped CI =.01, .07); (f) low empathetic awareness → parental warmth → LPE ages 10–12 → LPE age 20 (αβ=.02, p=.05; bootstrapped CI =.002, .03). All pathways shown were modeled in the final model. Solid lines are those pathways that were significant in the final model; dashed lines represent pathways that were modeled in the final model but were not significant.

