Fig. 5.

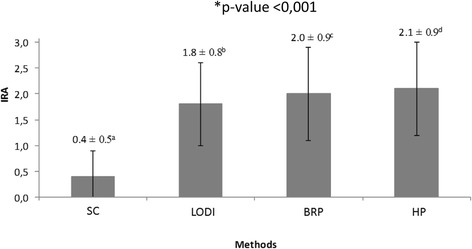
Mean ± standard deviation ARI scores registered with the four debonding methods tested. *Statistical difference between the methods (Friedman test). Different letters (superscript a, b, c) represent statistical difference (Wilcoxon test)

Mean ± standard deviation ARI scores registered with the four debonding methods tested. *Statistical difference between the methods (Friedman test). Different letters (superscript a, b, c) represent statistical difference (Wilcoxon test)