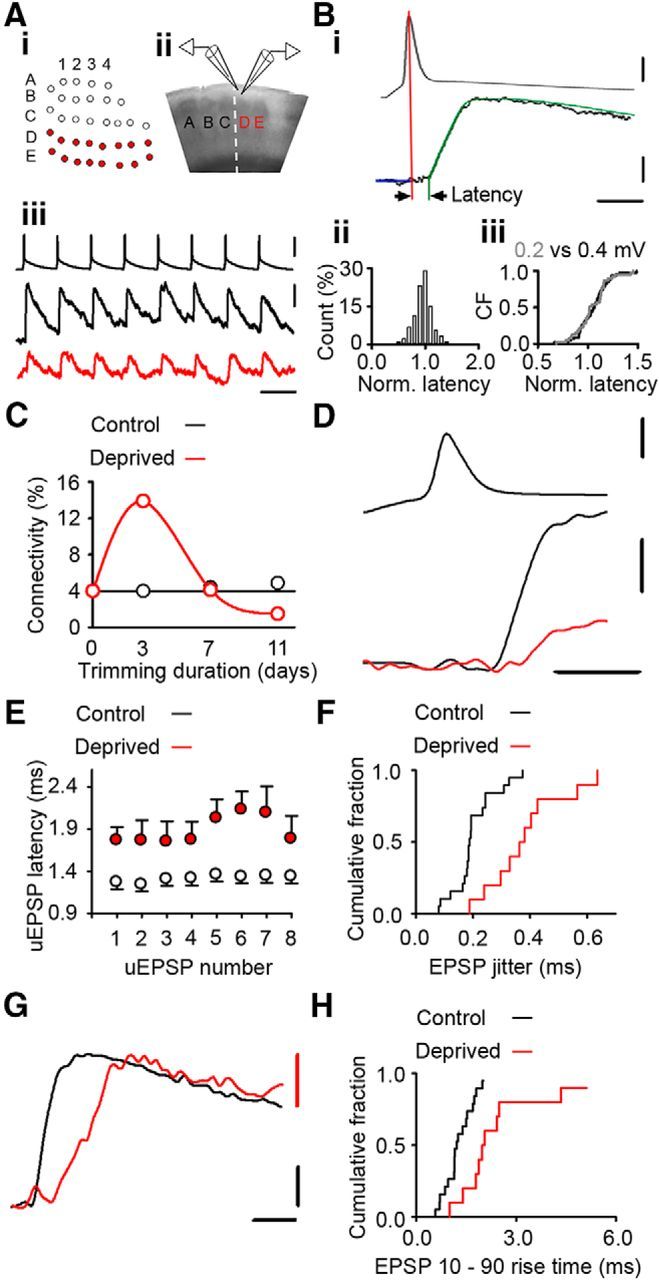
Figure 1.

Altered timing of neurotransmission at excitatory connections in deprived cortex. Ai, Schematic of a D-E whisker row trim [white circles, untrimmed whiskers (spared); red circles, trimmed whiskers (deprived)]. Aii, Brain slice showing position of recording electrodes in L2/3 of deprived D barrel column. Aiii, Twenty Hertz train of presynaptic action potentials (upper trace) and evoked postsynaptic uEPSPs recorded from synaptically connected neurons in control (black, middle trace) and 4–8 d deprived (red, lower trace) cortex. Calibrations: 50 mV, 0.1 mV; 50 ms. Bi, Example latency measurement: peak of action potential, vertical red line; uEPSP fit, green; baseline, blue line. Arrowheads indicate the latency measurement. Calibrations: 0.1 mV, 30 mV; 2.5 ms. Bii, Histogram of normalized latency times measured from simulated uEPSPs with known latency. Biii, Empirical distribution functions of normalized latencies for 0.2 (gray) and 0.4 mV (black) simulated uEPSPs were not statistically different (p = 0.930, t test). C, Connectivity between L2/3 pyramidal neurons varies with duration of whisker deprivation [2–3 d, 13/93 (14.0%) tested connections; 4–8 d, 8/195 (4.1%) tested connections; p = 0.012, χ2 test]. D, Expanded trace depicting increased synaptic latency at weakened connections in deprived cortex. Top, Action potential. Bottom, Overlay of example uEPSPs in control (black) and deprived (red) cortex. Calibrations: 50 mV, 1 mV; 2 ms. E, uEPSP synaptic latency in deprived cortex (red) is increased after 4–8 d deprivation (uEPSP1: deprived 4–8 d = 1.7 ± 0.2 ms, n = 10; control 1.2 ± 0.1 ms, n = 19; p = 0.007, t test) and throughout a 20 Hz train stimulus train (uEPSP 2–8: deprived 1.7 [1.3–2.6] ms, n = 10; control 1.3 [1.0–1.5] ms, n = 19, p = 0.014, MWRST). F, Empirical distribution plot of the uEPSP1 jitter in control (black) and deprived (red) cortex. The jitter is greater in deprived cortex than in control cortex (deprived 0.38 ± 0.04 ms, n = 10; control 0.20 ± 0.02 ms, n = 19; p < 0.001, t test). G, EPSP trace from deprived cortex (red) scaled to amplitude of control trace (black; average of 50 responses) illustrates increased rise time in deprived cortex. Calibrations: 0.1 mV; 2 ms. H, Empirical distribution plots of uEPSP1 rise time in deprived (red) and control (black) connections. The uEPSP rise time is greater in deprived cortex (deprived 2.0 [1.7–3.0] ms, n = 10; control 1.2 [1.0–1.7] ms, n = 19; p = 0.001, MWRST).
