Figure 2.
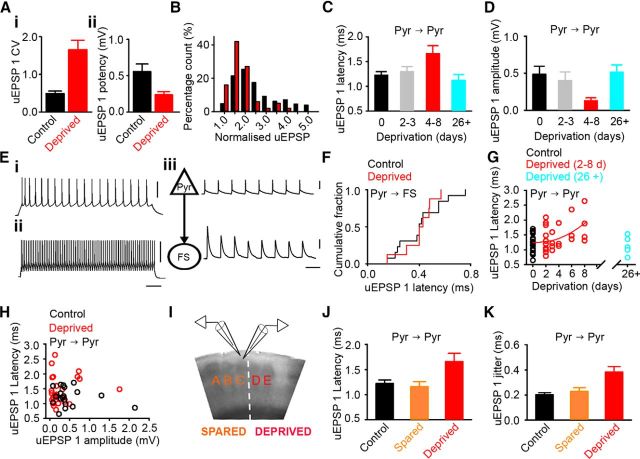
Altered timing of neurotransmission occurs in concert with loss of excitatory connections in deprived cortex. Ai, uEPSP1 coefficient of variation was greater at connections in 4–8 d deprived cortex (deprived 1.43 [1.22–2.41], n = 10; control 0.45 [0.29–0.59], n = 19; p < 0.001, MWRST). Aii, Mean uEPSP1 potency is reduced in deprived cortex (deprived 0.20 [0.15–0.27] mV, n = 10, control 0.41 [0.29–0.62] mV, n = 19; p = 0.002, MWRST). B, Histogram of normalized uEPSP1 amplitude is shifted toward values of 1 in 4–8 d deprived cortex (red) compared with 2–3 d deprived cortex (black; deprived 4–8 d = 1.4, [1.1–1.7], n = 100; deprived 2–3 d = 2.0 [1.5–2.8], n = 435; p < 0.001, MWRST). C, uEPSP1 latency in deprived cortex is longer after 4–8 d deprivation compared with 2–3 d deprivation, 26+ d deprivation, and controls (uEPSP latency: 4–8 d, 1.7 ± 0.2 ms, n = 10; 26+ d, 1.1 ± 0.1 ms, n = 6, p = 0.017; 2–3 d, 1.3 ± 0.1 ms, n = 15, p = 0.022; control, 1.2 ± 0.1 ms, n = 19, p = 0.015; one-way ANOVA). Error bars indicate SEM. D, uEPSP1 amplitude in deprived cortex is reduced following 4–8 d deprivation compared with 2–3 d deprivation, 26+ d deprivation, or controls (uEPSP1 amplitude: 4–8 d, 0.13 ± 0.04 mV, n = 10 connections; 2–3 d, 0.40 ± 0.12 mV, n = 15 connections, p = 0.010; 26+ d, 0.51 ± 0.10 mV, n = 6 connections, p = 0.003; control, 0.49 ± 0.11 mV, n = 19 connections, p < 0.001; one-way ANOVA on log transformed data). Error bars indicate SEM. E, spiking evoked by 500 ms depolarizing current pulses in the presynaptic pyramidal neuron (Ei) and postsynaptic FS interneuron (Eii) of a Pyr→FS connection. Calibrations: 50 ms, 50 mV n. Eiii, Action potentials in the presynaptic pyramidal neuron (triangle) elicit uEPSPs in the postsynaptic FS interneuron (circle). Calibrations: 50 ms, 50 mV, 1 mV. F, The latency of uEPSPs in FS interneurons is similar in control (0.4 ± 0.1 ms, n = 13) and 4–8 d deprived cortex (0.4 ± 0.1 ms n = 8, p = 0.878, t test). G, uEPSP latency of L2/3 Pyr→Pyr connections increases with the duration of deprivation. The expected uEPSP latency from the statistical model for 0–8 d deprivation is shown by the red curve, uEPSP latency = 1.1891 + 0.0107(days of deprivation)2 + 0.1041(uEPSP amp). Cyan, uEPSP latencies after 26 d of deprivation. H, uEPSP amplitude and latency do not covary in control (r = −0.09, p = 0.721) or deprived (r = 0.04, p = 0.853) cortex. I, Brain slice showing position of recording electrodes in L2/3 of spared C barrel column (orange) adjacent to the deprived D barrel column (red). J, uEPSP1 latency in spared cortex is similar to controls whereas latency of deprived connections is longer (control 1.22 ± 0.07 ms, n = 19; 26+ d spared 1.16 ± 0.10 ms, n = 14; 4–8 d deprived 1.66 ± 0.16 ms, n = 10; control vs spared p = 0.640, control vs deprived p = 0.011, one-way ANOVA). K, uEPSP1 jitter in spared cortex is similar to controls whereas jitter of deprived connections is greater (control 0.20 ± 0.02 ms, n = 19; 26+ d spared 0.23 ± 0.03 ms, n = 14; 4–8 d deprived 0.38 ± 0.04 ms, n = 10; control vs spared p = 0.450, control vs deprived p < 0.001, one-way ANOVA).

