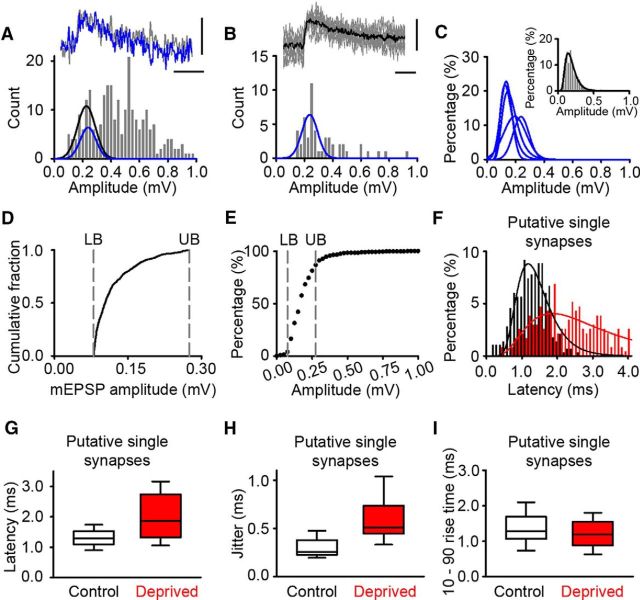
Figure 4.
Increased latency of putative single-synapse EPSPs in deprived cortex. A, Top, Example traces recorded in 2 mm Ca2+ (gray) or 1 mm Ca2+ (blue). Bottom, Histogram of EPSP amplitudes from a control connection recorded in 2 mm Ca2+ and 1 mm Mg2+. Blue Gaussian fit is taken from putative single-synapse responses in B (R2 = 0.65, p < 0.001), and black Gaussian is the fit to the 2 mm calcium data over the same amplitude range as the blue Gaussian fit (R2 = 0.78, p < 0.001). Calibrations: 0.15 mV, 10 ms. B, Top, Example putative single-synapse response recorded in low calcium with the average response (black) superimposed. Bottom, Histogram of EPSP amplitudes recorded in 1 mm Ca2+ from the connection in A. Calibrations: 0.15 mV, 10 ms. C, Gaussian or log normal fits to postsynaptic responses recorded in low calcium for all the connections used to estimate putative single-synapse response amplitude (R2 values range from 0.65 to 0.91). Inset, Pooled low-calcium data from the six connections with log normal fit in black (R2 = 0.94, p < 0.001). D, Cumulative fraction plot of 1250 mEPSP amplitudes recorded from 25 L2/3 pyramidal neurons with 2 mm extracellular calcium. Dashed gray lines signify the lower boundary (LB; 85 μV) and upper boundary (UB; 0.28 mV) of the mEPSP range. E, Cumulative fraction plot of putative single-synapse uEPSP responses recorded in 1 mm extracellular calcium. The dashed gray lines, which signify the LB and UB taken from the mEPSP data in D, enclose >85% of the putative single-synapse uEPSP responses recorded in low calcium. F, Latency histogram for putative single-synapse latencies in control (black; log normal fit, R2 = 0.88, p < 0.001) and deprived cortex (red; log normal fit, R2 = 0.66, p < 0.001). G, Average latency for putative single-synapse responses in deprived cortex (1.86 [1.30–2.75] ms, n = 10 connections) is greater than that in control cortex (1.30 [1.11–1.53] ms, n = 19 connections, p = 0.017, MWRST). H, EPSP jitter for putative single-synapse responses in deprived cortex (0.51 [0.45–0.74] ms, n = 10 connections) is greater than that in control cortex (0.25 [0.23–0.38] ms, n = 19 connections, p < 0.001, MWRST). I, EPSP 10–90 rise times for putative single-synapse responses recorded were similar in deprived and control cortex (deprived: 1.21 ± 0.04 ms, n = 110 responses; control: 1.34 ± 0.07 ms, n = 110 responses; p < 0.096, t test).

