Figure 8.

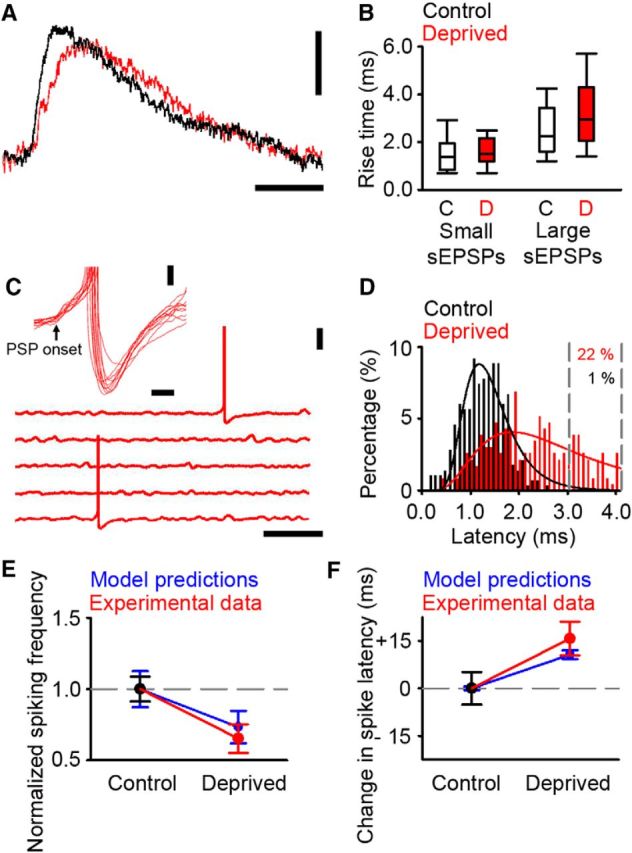
Altered firing in deprived cortex during ongoing activity in vitro. A, Example traces of sEPSP in control (black) and deprived (red) cortex. Calibrations: 0.5 mV, 10 ms. B, Rise time of small sEPSPs (presumed mEPSPs) in control (white fill) and deprived (red fill) cortex were similar (control 1.4 [0.8–2.0] ms, n = 40; deprived 1.5 [1.2–2.2] ms, n = 101; p = 0.206, MWRST). Large sEPSPs have longer rise times in deprived cortex (control 2.3 [1.6–3.5] ms, n = 81; deprived 3.0 [2.1–4.3] ms, n = 168; p < 0.001, MWRST). C, Example of PSP-evoked action potentials in 5 s traces of ongoing synaptic activity recorded from neurons in deprived cortex. Neurons were depolarized with constant somatic current injection to values that were close to threshold. Calibrations: 20 mV, 1 s. Inset, Examples of PSP-evoked action potentials in deprived cortex aligned to the onset of the PSP (black arrow). Calibrations: 2 mV, 20 ms. D, Latency histogram adapted from Figure 4F for putative single-synapse latencies in control (black) and deprived (red) cortex. Gray dashed lines denote the percentage of the deprived responses with latency values that are >99% of the control distribution. The percentage of deprived responses in this range is 22%. E, Comparison of change in firing frequency predicted by the model with the firing frequency found in vitro. Model and experimental data were normalized with respect to their respective control conditions. F, Comparison of the change in spike latency predicted by the model compared with the delay found in vitro. Time differences are expressed with respect to the control spike latency.
