
Figure 2.
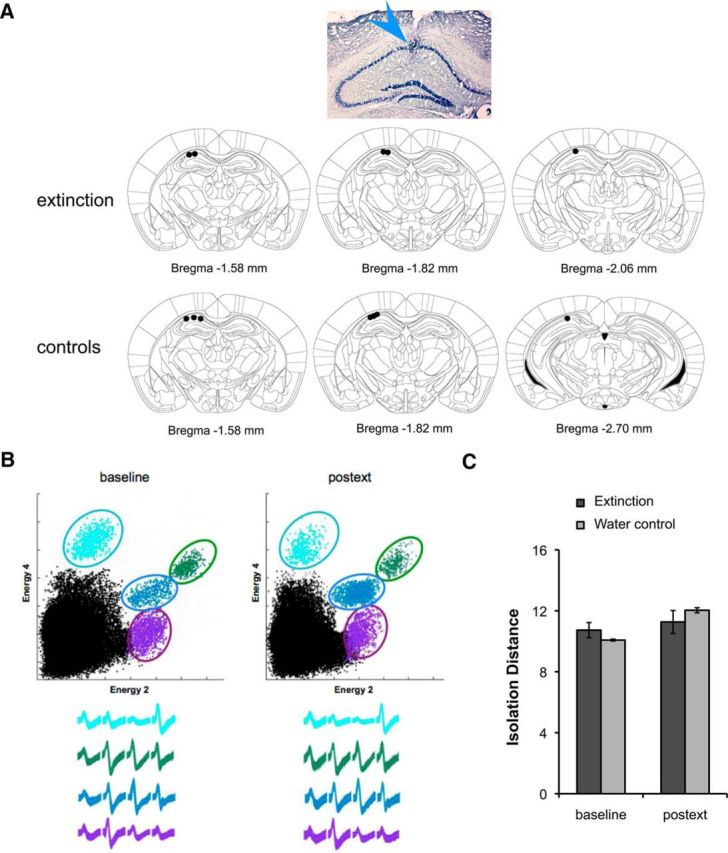
A, Photomicrograph of Nissl-stained coronal section showing position of electrode bundle and schematic coronal sections showing the position of all electrodes in the extinction (n = 5) and control (n = 7) groups. B, Cluster projections and waveforms recorded during baseline and 24 h postext showing recording stability. C, Analysis of cluster quality showing no significant differences between the extinction and control group throughout the recording period. Isolation distance, a measure of cluster quality that determines how separated each cluster is from noise and other cells, was computed during baseline and 24 h postext. For the clusters shown in B, isolation distance values are the following: light blue: 11.5, 9.2; green: 14.2, 17.1; blue: 22.3, 23.4; purple: 17.4, 10.4. Bars represent means ± SEM, *p < 0.05.