
Figure 3.
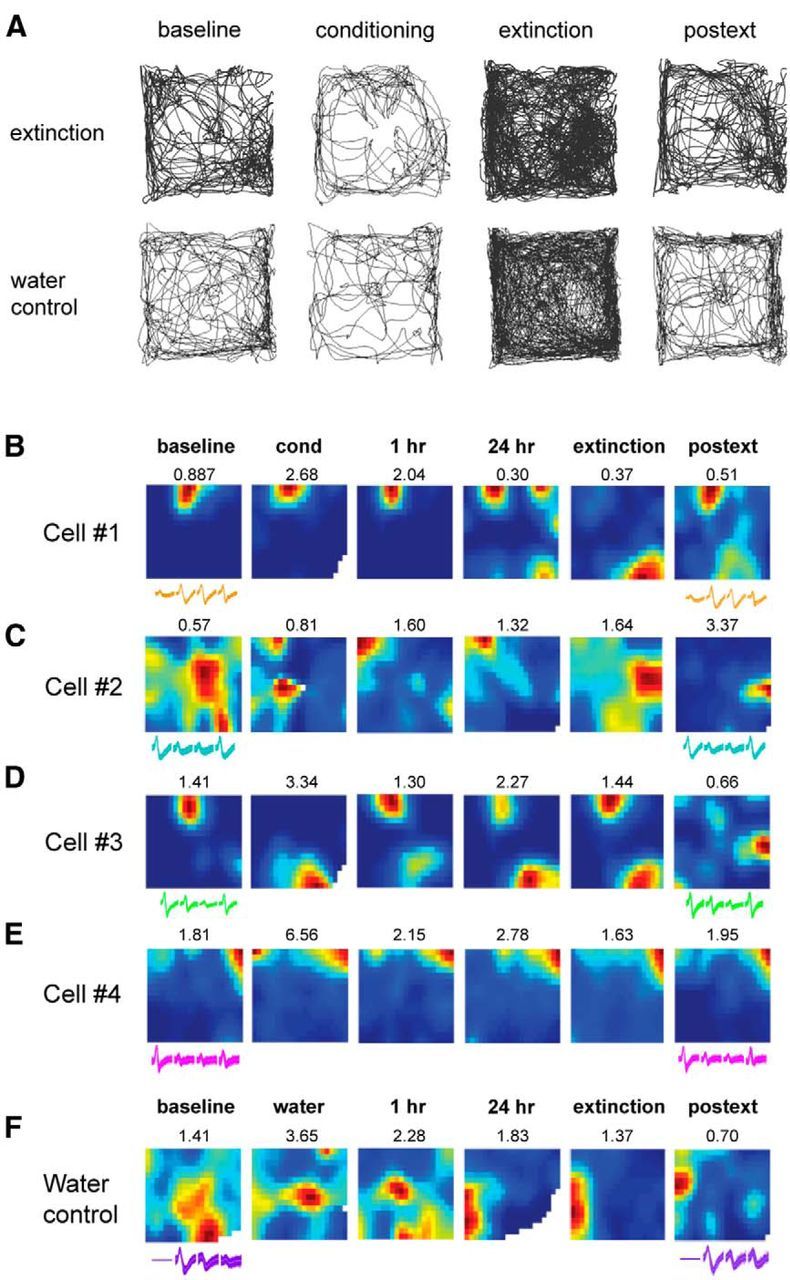
A, Example paths from a water control and an extinction animal showing complete sampling of the environment. B–F, Examples of place cell rate maps. Activity was normalized relative to the peak firing frequency shown on top of each rate map. Blue represents areas visited by the animal where a particular place cell does not fire, and more vivid colors represent areas of increasing firing activity for that cell. Remapping was observed both during conditioning and the 30 min extinction session, although different cells displayed different phenotypes. B, Example cell that exhibits remapping during extinction. C, Example cell that remaps during both fear conditioning and extinction. D, Example cell that remaps during fear conditioning but remains stable in extinction. E, Example cell that remains stable throughout fear and extinction learning (static cell). F, Example cell from a water control animal that did not undergo fear conditioning or extinction. Waveforms at the beginning and end of the recording period are shown below each map. The constancy in the waveforms indicates recording stability.