
Figure 5.
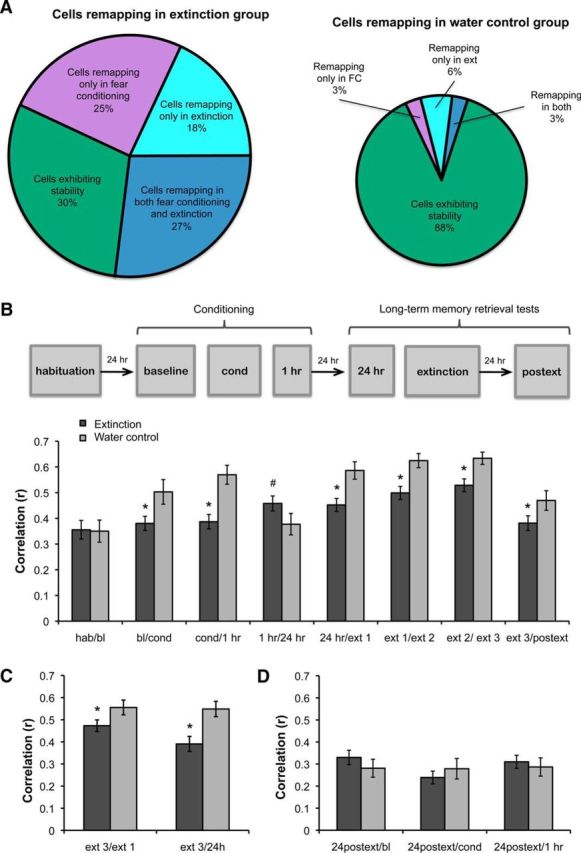
A, Pie charts showing percentages of cells remapping or remaining stable during conditioning and extinction in the extinction and water control groups. B–D, Pixel-by-pixel cross-correlations between sessions in the extinction and water control groups. B, In the extinction group (n = 5, 107 cells), place fields were significantly less stable during fear conditioning, extinction, and 24 h after extinction compared with the water control group (n = 3, 40 cells). C, This effect was also observed when comparing the third extinction interval with the first, and when comparing the third extinction interval with the 24 h session immediately before extinction. D, In the extinction and the water control groups, place field maps formed 24 h after extinction did not resemble previous maps from baseline, fear conditioning, and 1 h sessions. Bars represent means ± SEM, *p < 0.05.