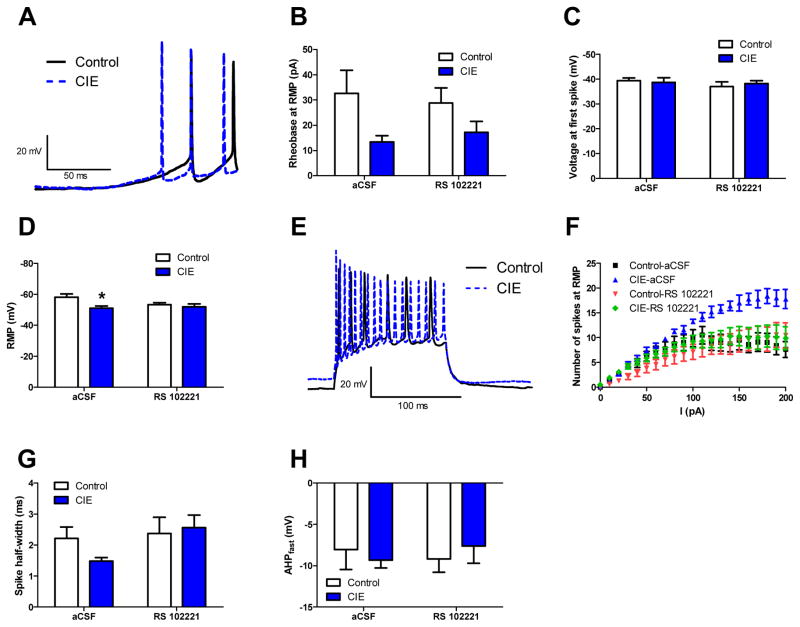
Figure 3.
Neuronal excitability in the vBNST increases 24 hours after CIE in a 5HT2c-R dependent fashion. Representative traces of voltage ramp used to determine rheobase (A), the average rheobase (B), the average voltage at first spike (C), and the average RMP (D). Representative traces from control and CIE cells of the current step protocol used to determine VI plot (E) and the average VI plot across all groups (F). The average spike width (G) and the average AHP amplitude (H) across all groups

