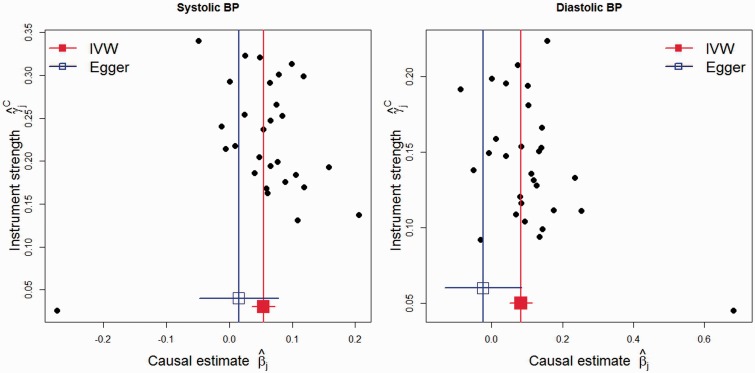
Figure 4.
Genetic associations with blood pressure and coronary artery disease risk from 29 variants—funnel plots of minor allele frequency corrected genetic associations with blood pressure () against causal estimates of blood pressure on CAD based on each genetic variant individually (). Left: funnel plot for systolic blood pressure. Right: funnel plot for diastolic blood pressure. The inverse-variance weighted (IVW) and MR-Egger causal effect estimates are also shown.

