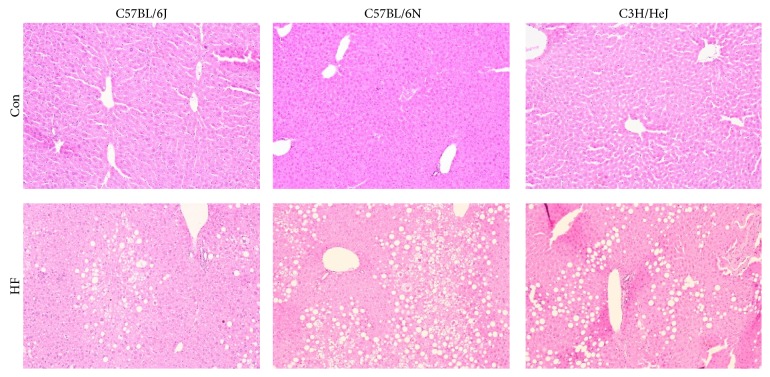
Figure 5.
Representative micrographs of liver histology sections stained with hematoxylin and eosin from C57BL/6J, C57BL/6N, and C3H/HeJ mice following 24 wk on a control (Con; AIN-93M) or a high fat diet (HF; 45% kcal from fat). Representative images were photographed and are presented at a 10x magnification.

