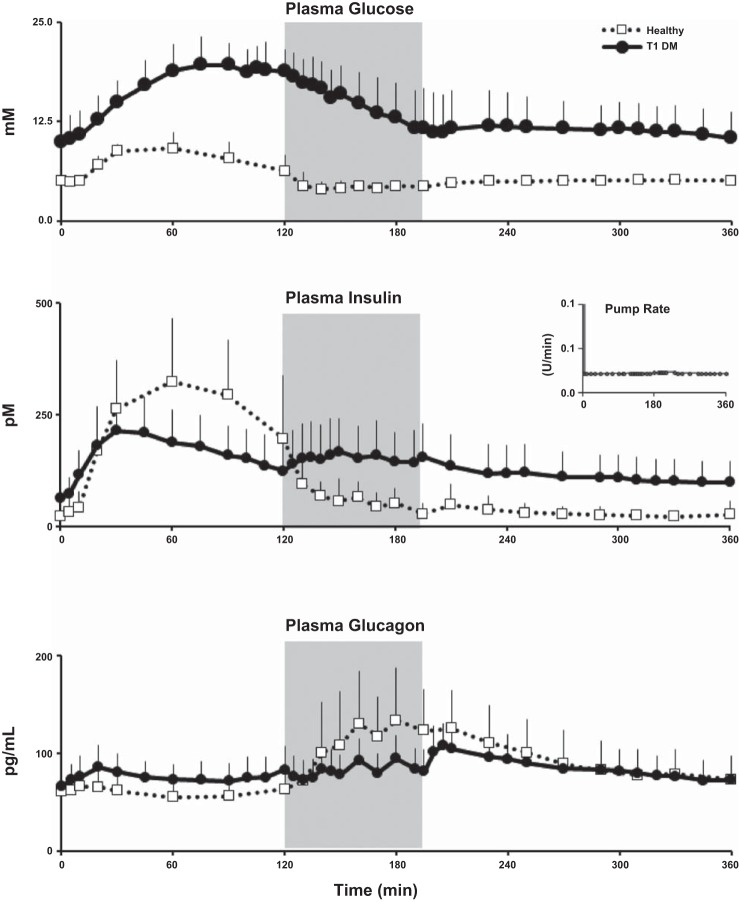
Fig. 4.
Glucose (top), insulin (middle), and glucagon (bottom) concentrations obtained from time 0 to 360 min in T1D subjects (solid line and ●) and healthy controls (dotted line and □). Shaded box between 120 and 195 min represents exercise period at 50% V̇o2max. Inset in middle shows the mean insulin pump infusion rates during the study in T1D subjects.

