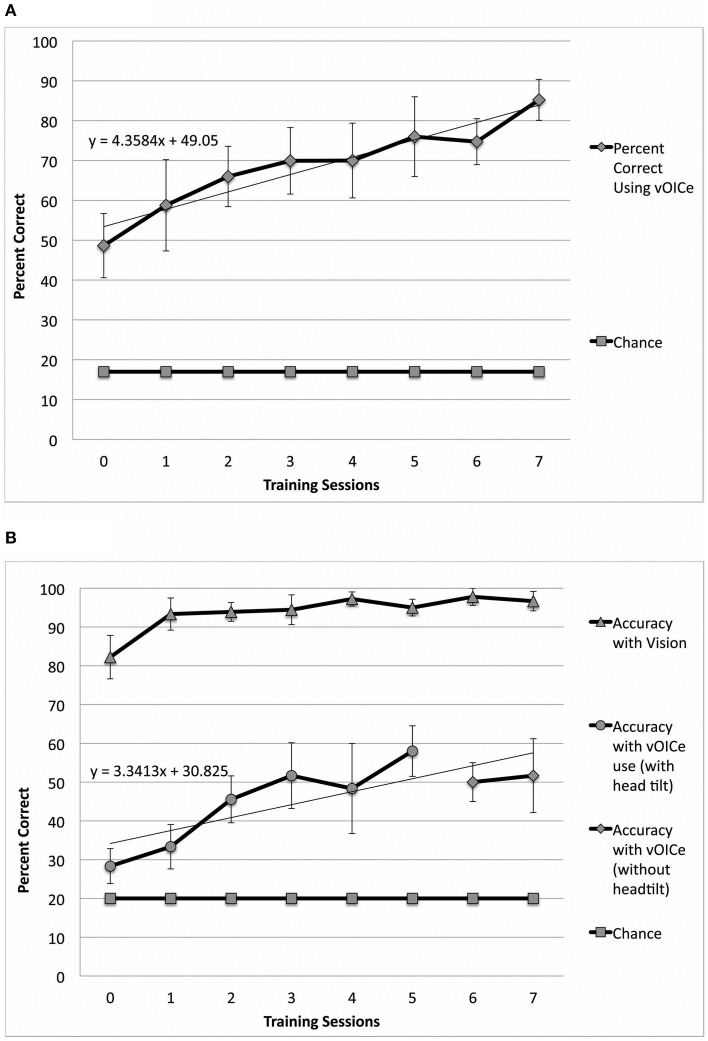
Figure 2.
Performance in both constancy tasks by sighted subjects (N = 9 – 10). In (A) the orientation constancy task performance (classification of line orientation angle independent of head tilt) is plotted as a function of the number of training sessions (N = 10). In (B) the length constancy task performance (classification of line length independent of line orientation angle) is plotted as a function of the number of training sessions (N = 9). Error bars represent the one standard deviation for both plots. (Note: See methods for subject inclusion and exclusion for each plot).

