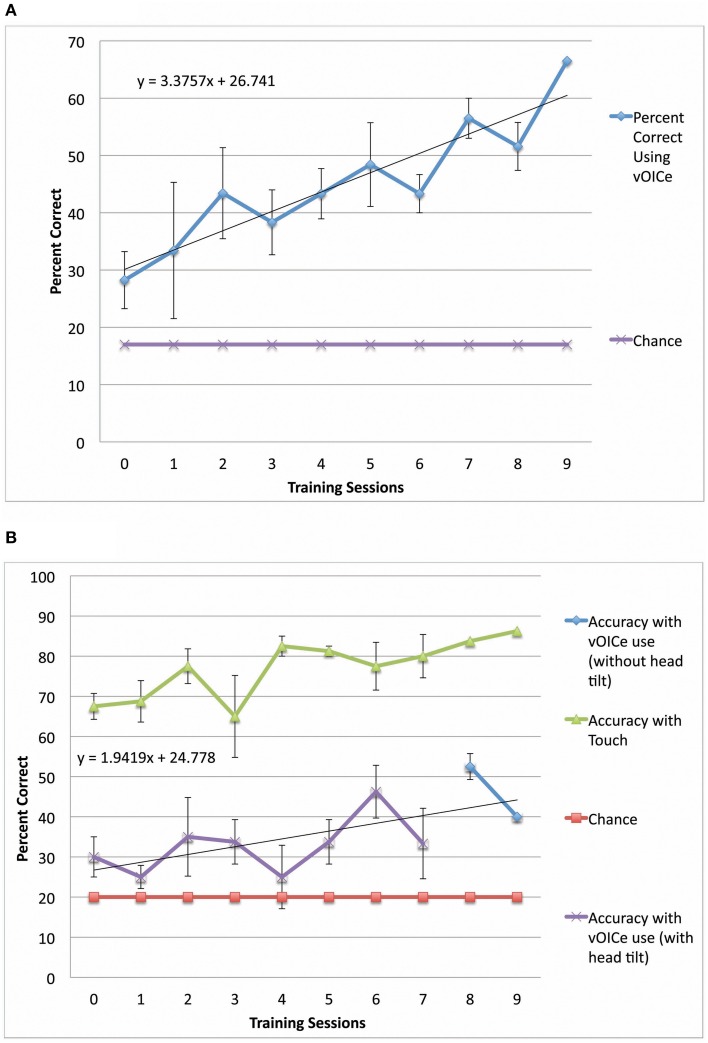
Figure 3.
Performance in both constancy tasks by blind subjects (N = 4). (A) Plots the task performance of orientation constancy as a function of the number of training sessions in the blind participants only (N = 4). (B) Plots the task performance of length constancy as a function of the number of training sessions in the blind participants only (N = 4). The error bars represent the one standard deviation for both plots.

