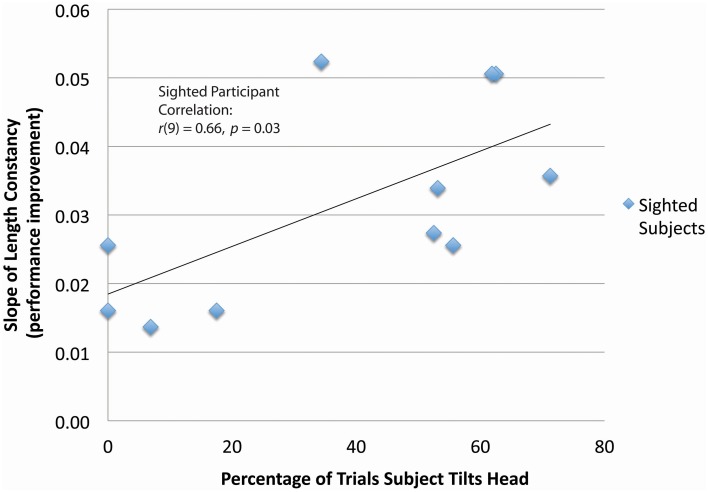
Figure 4.
Correlation between head tilt and performance improvement for the length constancy task (N = 11). Significant correlation between head tilt and performance improvement is shown for the length constancy task (N = 11) [r(9) = 0.66, p = 0.03]. (Note: See methods for subject inclusion and exclusion). The slopes of length constancy are the slopes of the plots of length constancy percent correct as a function of the training time for each subject. A larger positive slope corresponds to a larger performance improvement per training session.

