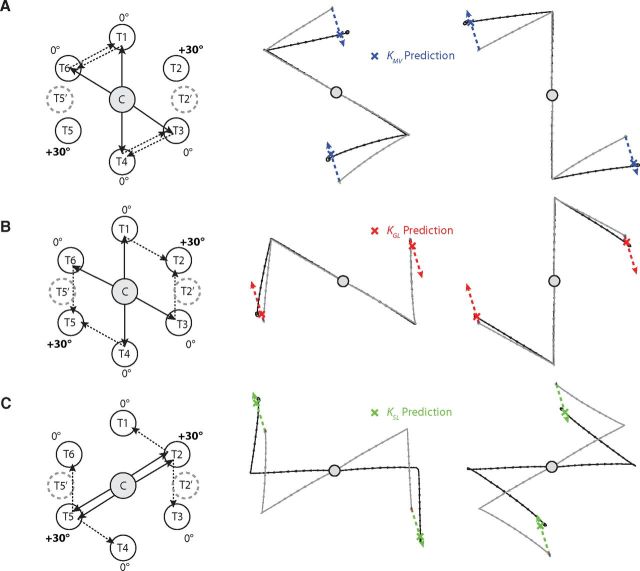
Figure 5.
Results of the attribute-isolating experiment for individual movements. A, Four different movement configurations with isolated MV adaptation from Experiment 1. Dashed blue arrows indicate the shifted ΔMV, as shown in Figure 2. All hand paths display across-subject average movements with SE ellipse at the end point. The blue X indicates the best fit location of KMV over all four movements. Note that analysis of the lower right configuration was detailed in Figure 4A. B, Test movements with isolated GL adaptation. Red arrows indicate the shifted ΔGL. C, Test movements with isolated SL adaptation. Green arrows indicate shifted ΔSL.

