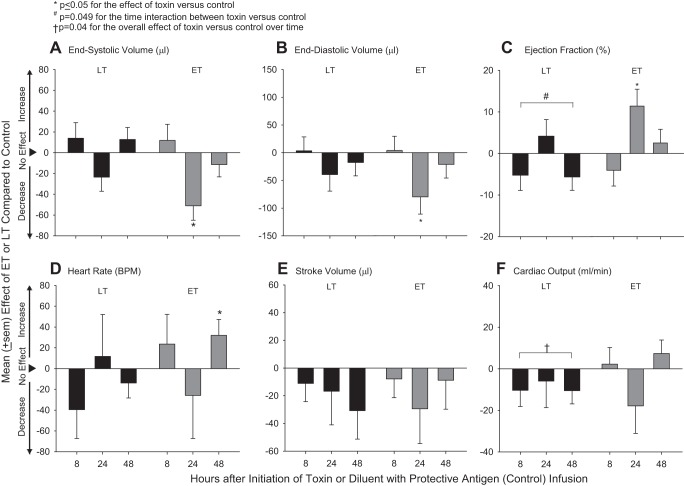
Fig. 3.
Mean ± SE effects of LT or ET compared with control animals on echocardiography-determined left ventricular (LV) end-systolic volume (A), LV end-diastolic volume (B), LV ejection fraction (C), HR (D), stroke volume (E), and cardiac output (F) at either 8, 24, or 48 h after the initiation of 24-h infusions of toxin or diluent. Effects were calculated by subtracting control values from toxin values (see materials and methods). Data for control animals are shown in Table 2.

