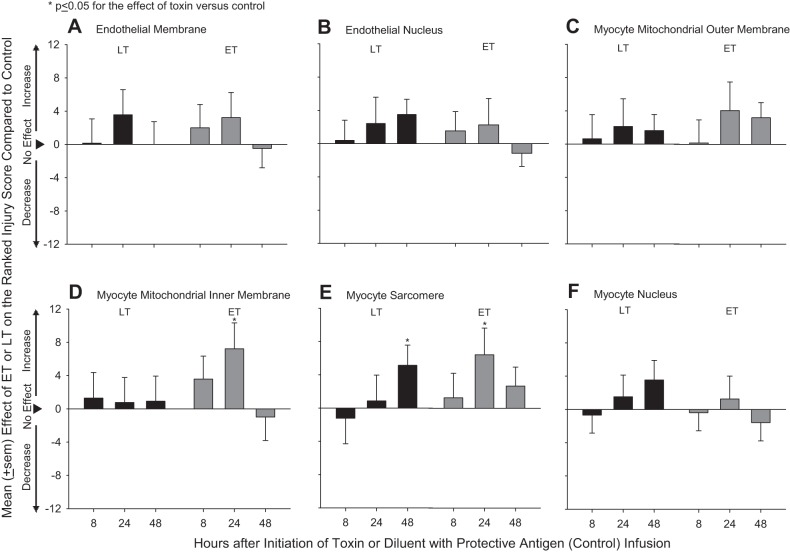
Fig. 7.
Mean ± SE effects of LT or ET compared with control animals on ranked tissue injury scores determined with electron microscopy in sections taken from hearts of animals at either 8, 24, or 48 h after the initiation of 24-h infusions of toxin or diluent. Ranked injury scores were determined for endothelial membranes (A) and nuclei (B), myocyte mitochondrial outer (C) and inner (D) membranes, and myocyte sarcomeres (E) and nuclei (F). Effects were calculated by subtracting control values from toxin values (see materials and methods). Data for control animals are shown in Table 2.

