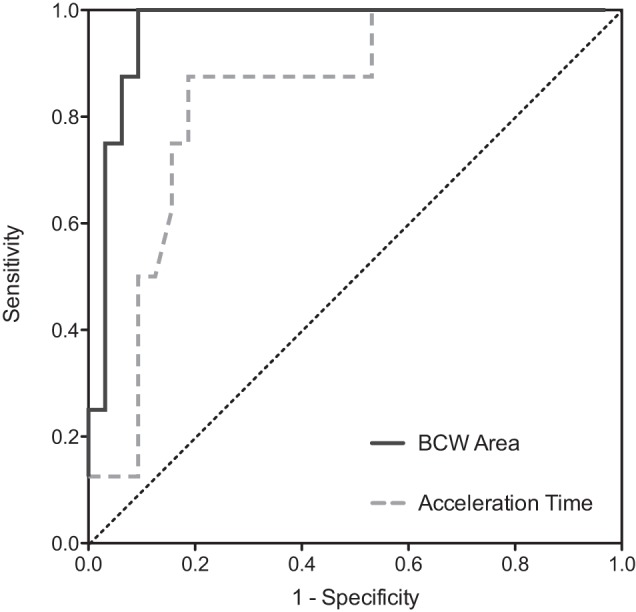
Fig. 3.

Receiver operating characteristics analysis for the detection of proximal pulmonary artery (PA) clot: sensitivity (y-axis) and 1-specificity (x-axis). BCW area (black solid line) area under the curve (AUC): 0.97; AT (gray dashed line) AUC: 0.84. Interrupted black line: line of identity.
