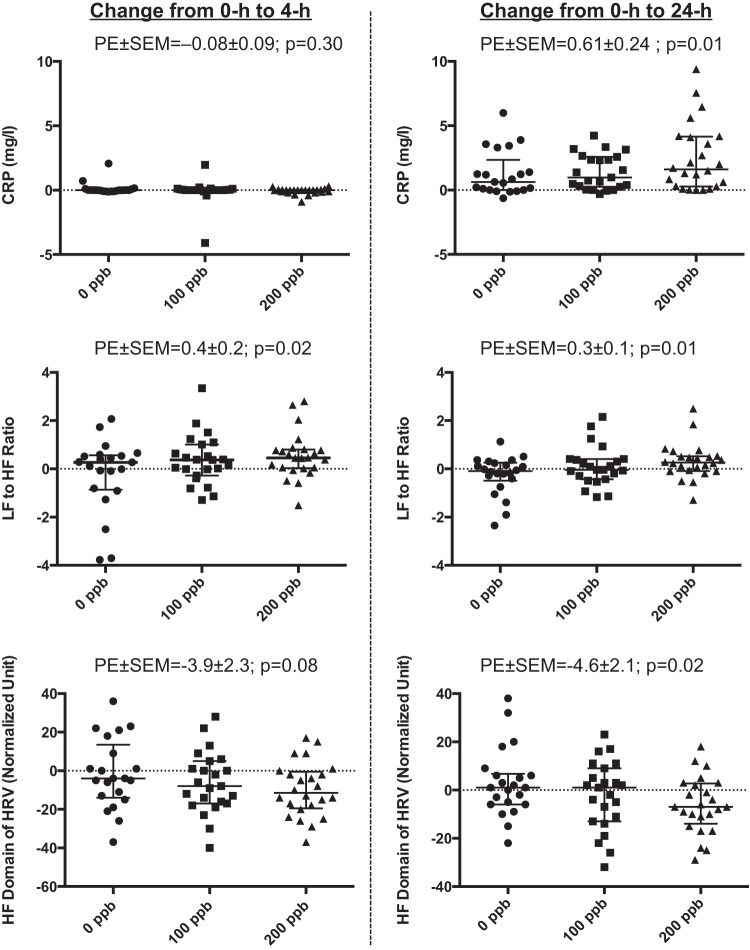
Fig. 2.
Change in systemic inflammatory and autonomic responses across ozone exposures. Graphs represent individual data as well as median and interquartile range of changes in inflammatory and autonomic variables across exposure (0 h to 4 h and 0 h to 24 h) to ozone at 0, 100, and 200 ppb levels. PE ± SE, parameter estimate ± SE from generalized estimating equation models of change in dependent variables for 100 ppb increase in ozone exposure; CRP, C-reactive protein; LF and HF, low and high frequency domains of heart rate variability; HRV, heart rate variability.

