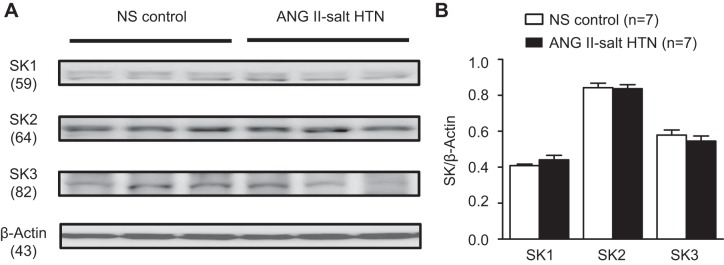
Fig. 5.

Expression of SK1–SK3 channels in the hypothalamic PVN. A: Western blot analysis showing protein expression of SK1–SK3 channels between rats in the NS control and ANG II-salt HTN groups. B: summary data showing no significant statistical difference in protein expression of SK1–SK3 channels in the punched PVN between the NS control group (n = 7) and ANG II-salt HTN group (n = 7). All values were normalized to β-actin.
