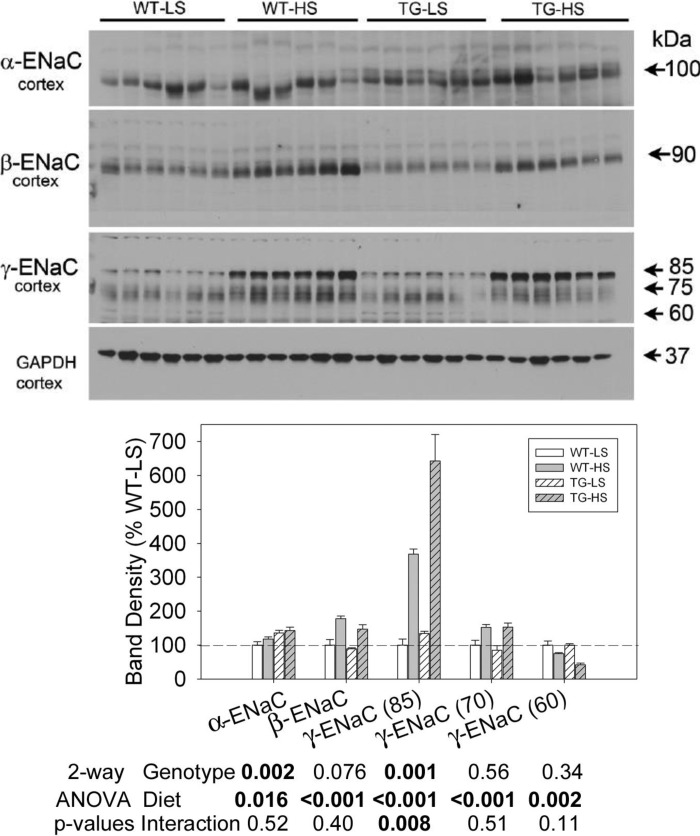
Fig. 10.
Effect of LS or HS diet on a background of aldosterone infusion on protein abundances of epithelial sodium channel (ENaC) subunits in cortical collecting ducts of WT and TG mice. Data presented here are derived from the same mice and experiment depicted in Fig, 6. Top: immunoblots for protein abundance of ENaC. Bottom: bar graph summary of the densitometric analysis of the immunoblots shown at top. Bars show percent change in band densities of different proteins in TG mice compared with the corresponding values in WT mice (100%). Results are means ± SE (n = 6 mice/genotype). Statistical significance, determined by two-way ANOVA, is shown at the bottom of the bar graphs.

