Fig. 5.
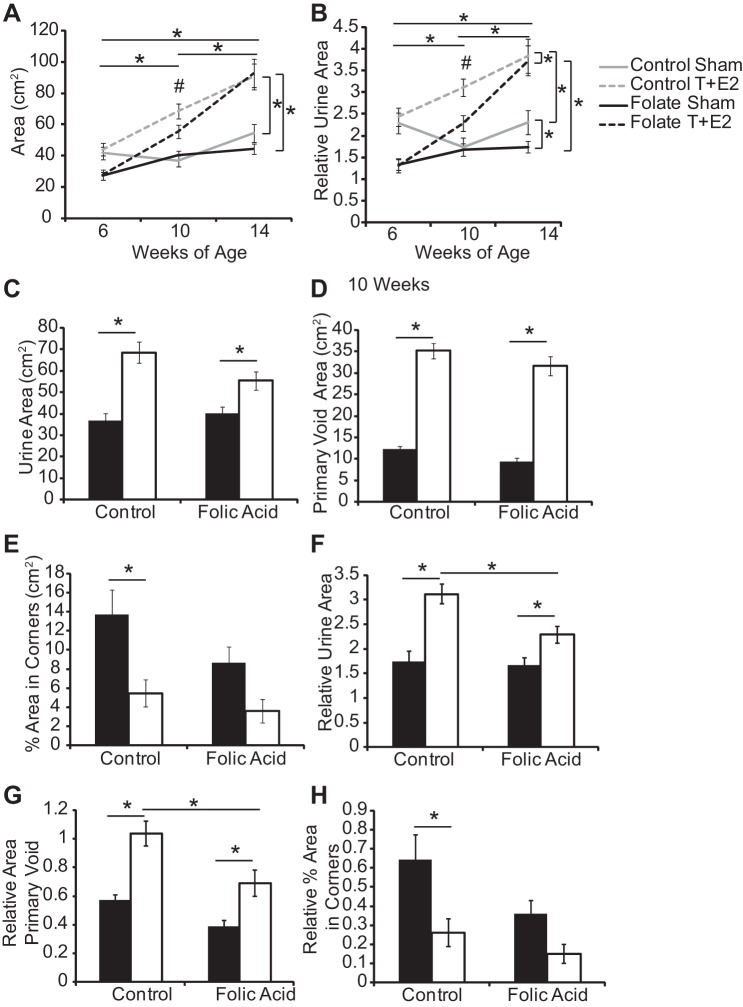
A folic acid-enriched diet protects against some T+E2-induced changes in void spot assay parameters. Adult male mice were treated as described in Fig. 1. Void spot assays were conducted at baseline, 1 mo, and 2 mo postsurgery. Shown are changes in urine area (A) and relative urine area (B) over time and quantification of urine area (C), primary void area (D), and percent area in corners (E) at 1 mo postsurgery. Void spot assay parameters were normalized to mouse body mass and include relative urine area (F), relative area in primary void (G), and relative percent area in corners (H). Values are means ± SE. *Significant difference, P ≤ 0.05. For repeated measures analysis, vertical bars indicate differences between treatment groups, and horizontal bars indicate differences over time. #Significant interaction between time and treatment group, P ≤ 0.05; n ≥5/group.

