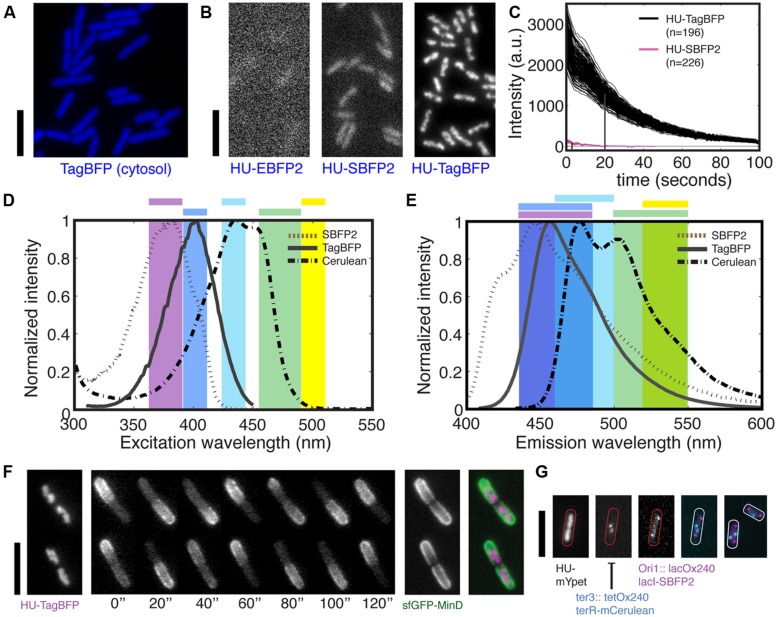
FIGURE 1.
Bright blue fluorescent proteins for multi-color imaging in bacteria. (A) TagBFP is bright when expressed from a genomic copy under a constitutive promoter for cytosolic label in live Escherichia coli cell. (B) Fluorescent images of HU-2 tagged by three blue fluorescent protein (BFP) variants in live E. coli during exponential growth. (C) Brightness and photostability of HU-TagBFP and HU-SBFP2 in live E. coli cells under the constant exposure to the Nikon Intensilight with the respective filter sets. Each line represents the average intensity of one nucleoid. The index n indicates the numbers of nucleoids examined. The vertical lines indicate the bleaching halftime. (D) Excitation spectra of SBFP2, TagBFP, and Cerulean (a CFP), and the ranges of bandpass filters (shown in color) used for the excitation of blue, cyan, green, and yellow FPs. Note that different filters were used for SBFP2 and TagBFP due to their different excitation peak. (E) Emission spectra of SBFP2, TagBFP, and Cerulean, and the ranges of bandpass filters used for collecting the fluorescent light emitted by blue, cyan, green, and yellow FPs. (F) Endogenous fusions HU-TagBFP and sfGFP-MinD are combined for dual-color imaging. From left to right: a HU-TagBFP image, an sfGFP-MinD time series, a per-pixel standard deviation (SD) image of sfGFP-MinD calculated over time, and a false-color overlay of HU2-TagBFP and sfGFP-MinD. (G) Three-colors imaging of chromosome and chromosomal loci using HU2 label and two operator-repressor systems. Shown are three individual images followed by an overlay of the latter two, and an extra example. All scale bars indicate 5 μm.

