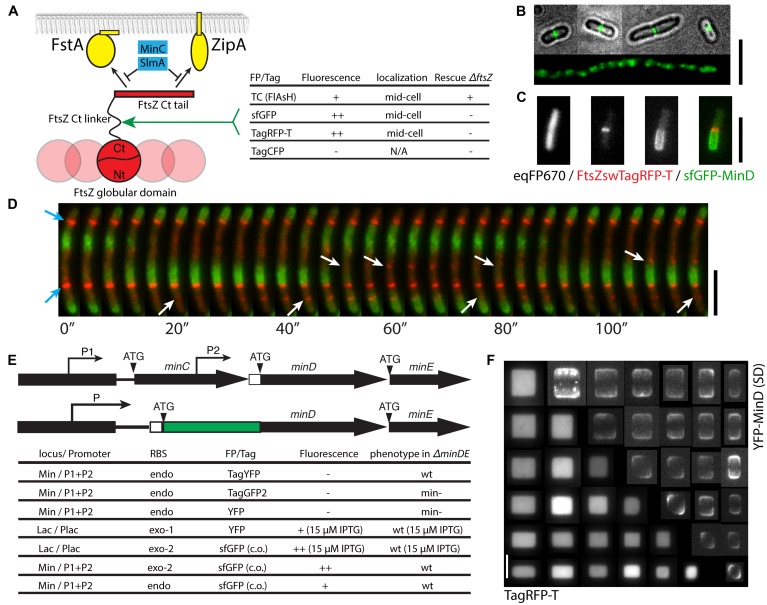
FIGURE 3.
Multi-color imaging of cell division at the green, yellow, orange, and near-infrared spectral range. (A) A sandwich fusion strategy for labeling FtsZ and the effectiveness of using various fluorescent tags or proteins. These fluorescent probes were inserted within the flexible linker between the extreme C-terminal tail of FtsZ that is responsible for the direct interactions with FtsA, ZipA, MinC and SlmA, and the globular structure responsible for polymerization. (B) Fluorescence microscopy images of a strain expressing FtsZswTC labeled by the FlAsH dye (in green). The top four cells show regular rod-shaped cells (cell boundary shown in gray scale) with central Z-ring (green), while the bottom one is part of a filamentous cell in the same culture showing overexpressed FtsZ fusion proteins (green). (C) A combination of near infrared, orange-red and green FPs for three-colors imaging (strain FW1559 with pFWZ4, induced with 0.0002% arabinose). The FtsZswTagRFP-T was expressed from an ectopic copy under the arabinose promoter PBAD. (D) Time-lapse images showing the dynamics of FtsZswTagRFP-T and sfGFP-MinD in an elongated cell (strain FW1554 with pFWZ4, induced with 0.0002% arabinose) treated with cephalexin. Blue arrows show stable Z-rings; white arrows indicate the locations where FtsZ proteins polymerize and depolymerize. All scale bars indicate 5 μm. (E) Schematic and table showing the effectiveness of the fluorescent labeling of MinD at different genomic loci with different promoters and RBSs. Note that for simplicity, the RBSs of MinC and MinE are not shown. P, promoter; ATG, start codon; the white box denotes the RBS; exo, exogenous; endo, endogenous. (F) Fluorescent images of strain FW1503 co-expressing cytosolic TagRFP-T and YFP-MinD used in a cell shaping experiment, where single cells grow into the shapes of nanofabricated chambers, as described in Wu et al. (2015). This shows that orange-red and yellow FPs can be combined for multi-color imaging. The bottom left show cytosolic eqFP670 fluorescence and the top right images are YFP-MinD standard-deviation image calculated from the 25 images taken in 2 min.

