Fig. 3.

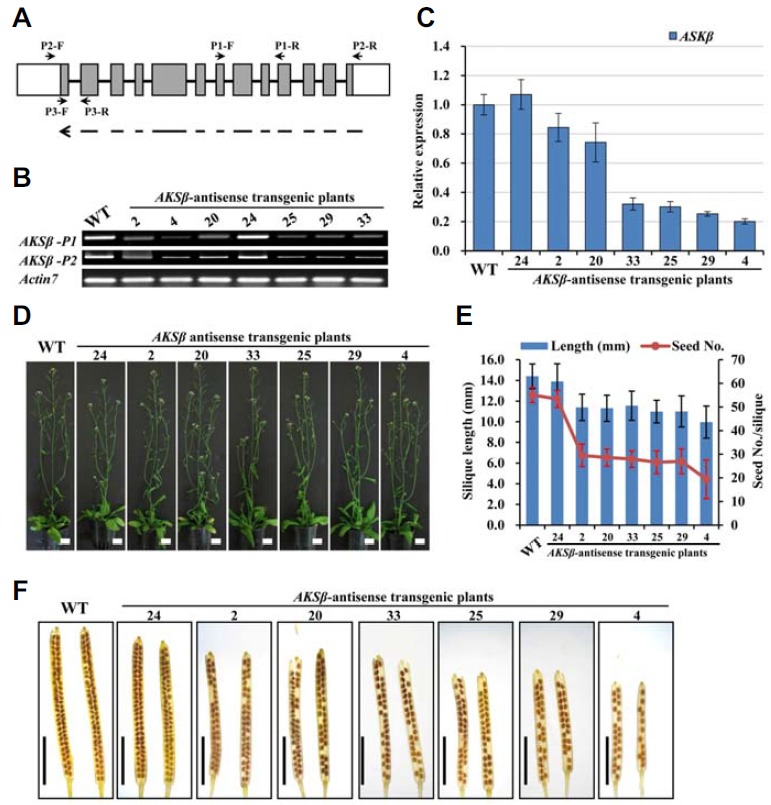
Analysis of ASKβ antisense transgenic Arabidopsis plants. (A) Schematic representation of the AKSβ gene structure and DNA fragments for antisense constructs. Gray boxes indicate exons, while the line and white boxes represent introns and UTRs, respectively. The dotted arrow in the antisense orientation at the bottom shows the DNA region used in the constructs. Arrows with names starting with “P” indicate the positions and directions of primers used: P1 and P2 for Semi-RTPCR, and P3 for qRT-PCR. (B) AKSβ transcript levels in floral buds of wild-type and antisense transgenic lines determined by semi-RT-PCR. ACTIN7 PCR was performed to validate that equal amounts of cDNA were used in each reaction. (C) Transcript levels of AKSβ and ASK measured by qRT-PCR. Expression levels were normalized to that of ACTIN7 and represented relative to wild-type expression levels. Error bars represent standard deviation (SD) of three biologically independent experiments. (D) Whole plant phenotypes showing no obvious differences between wild-type and ASKβ transgenic plants in vegetative growth. Bar = 20 mm. (E) Silique length and seed numbers. Mean values and SD were measured from three experiments using 18 plants per experiment. (F) Silique lengths and seed numbers in ASKβ antisense transgenic lines. Whole-mount images of mature siliques cleared with 0.2 NaOH and 1% SDS solution were used. Bar = 5 mm.
