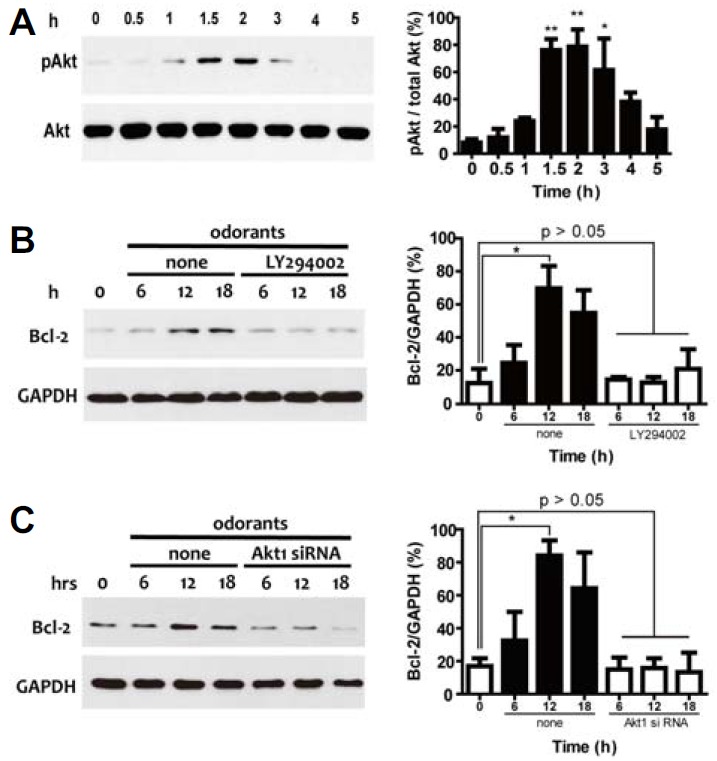
Fig. 2.

(A) Analysis of PI3K/Akt pathway activation by odorants. ORNs were treated with 10 μM odorants and sampled at a specific time (0, 0.5, 1, 1.5, 2, 3, 4, or 6 h). Activation of Akt was measured using antibodies against phospho-Akt (pAkt) and total Akt (Akt). Quantification of protein expression levels was determined by stereological analysis using the ImageJ analysis program. Equal loading of samples was confirmed by monitoring the total Akt protein level. (B) Pharmacological blocking of Akt activation. ORNs were incubated in 50 μM LY294002, a PI3K inhibitor. Akt activation was clearly blocked by LY294002. Immunoblots for Bcl-2 and GAPDH in the presence of 50 μM LY294002 at specific times (0, 6, 12, and 18 h) were visualized. Results of the quantitative analysis of Bcl-2 expression by odorants in the presence or absence of LY294002 for PI3K were summarized. (C) Translational blocking of Akt activation. ORNs were incubated with siRNA for Akt1 for 18 h. Akt activation was clearly blocked by incubation with siRNA. Immunoblots for Bcl-2 and GAPDH after incubation with siRNA for Akt1 at specific times (0, 6, 12, and 18 h) were visualized. Results of the quantitative analysis of Bcl-2 expression by odorants after incubation with siRNA for Akt1 were summarized. All data are presented as mean ± SEM. One-way ANOVA, followed by Dunnett’s post hoc test, was performed. *P < 0.05 and **P < 0.01 denote statistical significance.
