
Figure 7. Limit of detection.
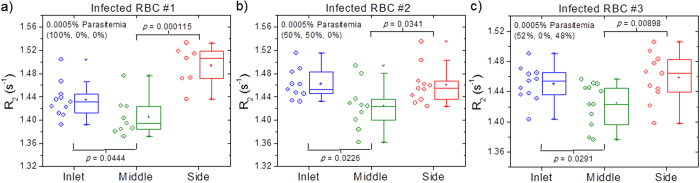
The R2 values at the inlet, middle, side for three different iRBCs with 0.0005% parasitemia with the lysis method. The parentheses indicate the percentage composition of each malaria infection stage (ring%, trophozoite%, and schizont%). As the iRBCs are marginated towards the sidewalls, the middle outlet is depleted of iRBCs. Hence, the middle R2 values would be significantly lower (with P-value < 0.05) compared to the inlet with the presence of iRBCs. For the sample of 100% ring at 0.0005% parasitemia in (a), the P-value is 0.0444 which indicate that the R2 distributions of the middle is statistically distinguishable from the inlet. The presence of middle and late stage infection of trophozoite and schizont in (b) and (c) increases the P-value further to 0.0226 and 0.0291, respectively.