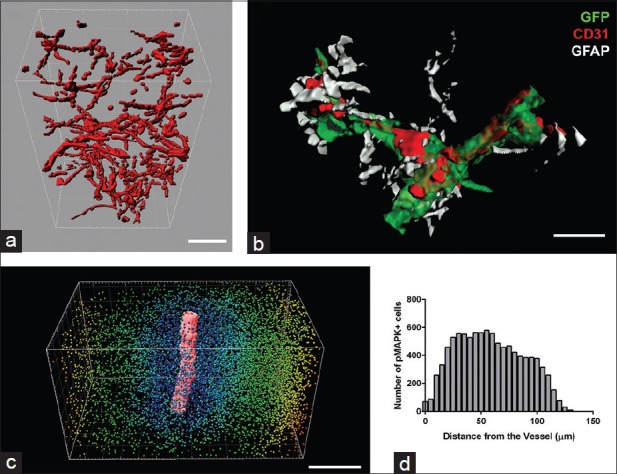
Figure 2.

Volumetric analysis of three dimension reconstructed serial sections. (a) CD31 blood vessel staining in reconstructed mixfibrosarcoma tissue was surface rendered using Imaris. The total volume of the vasculature as well as branching points and segment lengths can then be easily calculated. (b) Reconstructed brain region was highly zoomed in and rendered to show the intricate interaction between blood vessels (red), cancer cells (green) traveling along the blood vessels, and the astrocytes (white) supporting and interacting with cancer cells as well as blood vessels. Such detailed visualization of the 3 antigens can only be conducted with reliable and specific immunofluorescent staining. (c) The Imaris snapshot shows the surface rendering of a large CD31-positive blood vessel in the center (red) and spot detection of pMAPK-positive cells in the surrounding area. The color of each spot depicts the different distances from the blood vessels. (d) The graphic representation shows the distribution of the pMAPK-positive cells relative to the blood vessel. Scale bars: A =50 μm, B = 20 μm, C = 150 μm
