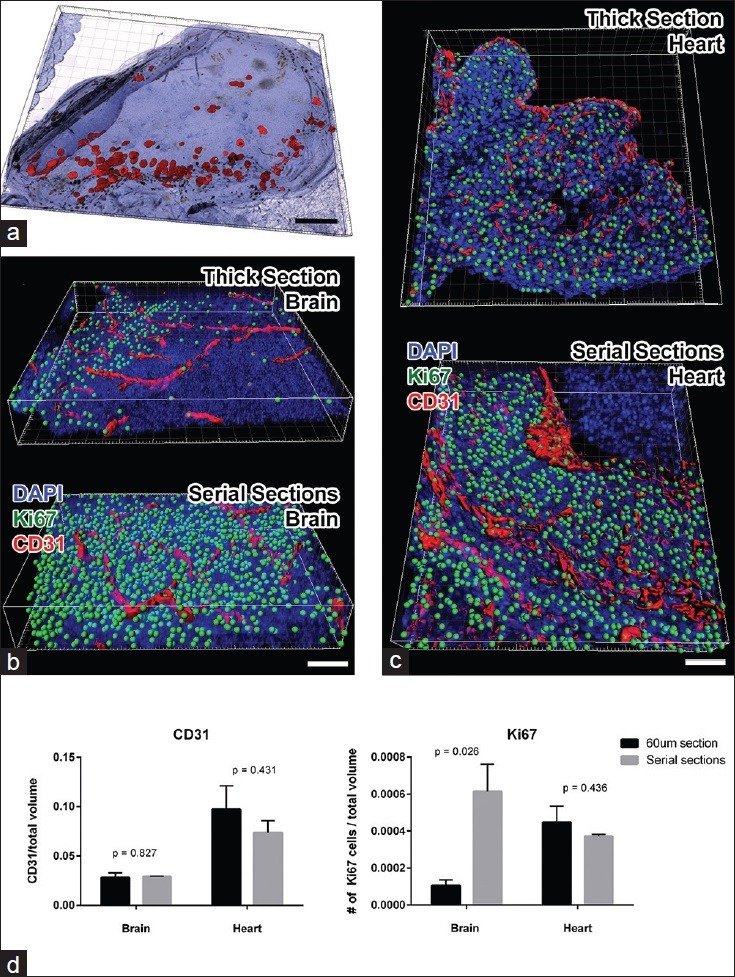
Figure 3.

Validation of volumetric analysis of reconstructed serial sections. (a) Imaris snapshot shows reconstructed ovary sections stained for p27 protein with DAB chromogen. The red surfaces show the rendering of the p27 signal using Imaris. In brightfield imaging, folds in the tissue can have similar spectral characteristics as DAB staining; therefore, automated count of p27-positive cells exceeded that of manual counting. (b) Imaris snapshots were taken from a brain region of a mouse embryo stained and imaged as a 60 μm thick section (above) and serially sectioned and reconstructed (below). CD31-positive vasculature is rendered in red and Ki67-positive nuclei were spot detected (green). One sees that staining and detection of Ki67 signal is much more extensive in the serial sections. (c) Similar snapshots were taken from the heart region of the same 60 μm (above) or serially sectioned (below) mouse embryo. In this area of the embryo, similar amounts of CD31 and Ki67 proteins were immunofluorescently detected in both methods. Results suggest that in the heart, antibody penetration in 60 μm thick section was more complete than in the brain. (d) Graphs depict the quantitative analysis of normalized CD31 volume (left panel) and of Ki67-positive cell counts (right panel). Student t-test comparison between thick section values and serial section values was performed, and the P values are indicated above the bars. Scale bars: A =500 μm; B and C = 50 μm
