
Fig. 4.
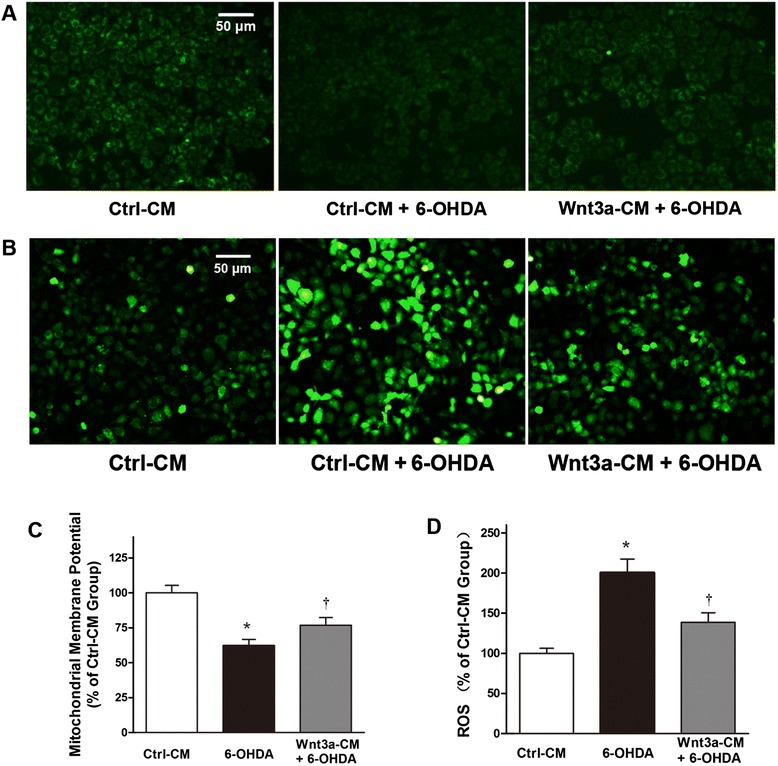
Mitochondrial membrane potential (MMP) AND intracellular ROS production. SH-SY5Y cells were treated with Ctrl-CM, Ctrl-CM + 6-OHDA (100 μM) or Wnt3a-CM (40 %) 20 min prior to 6-OHDA for 24 h, MMP (a) and intracellular ROS (b) were photographed by a fluorescence microscopy. Results of MMP (c) and intracellular ROS (d) are detected by a fluorescence spectrophotometer and expressed as relative fluorescent intensity. Data were presented as mean ± SD from four independent experiments. *P < 0.05 compared to Ctrl-CM group, †P < 0.05 compared to Ctrl-CM + 6-OHDA group