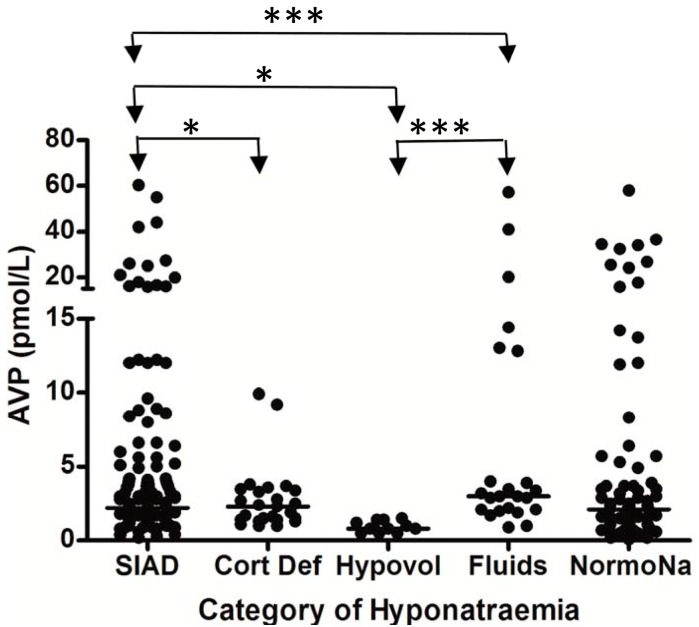
Figure 2.
Comparison of AVP levels between different patient groups in patients with hyponatremia following SAH; each point represents an individual AVP measurement; adapt from [6] with permission.
* p = 0.01; *** p < 0.0001; SIAD = hyponatremia due to SIADH; Cort Def = hyponatremia due to acute glucocorticoid insufficiency; Hypovol = hypovolemic hyponatremia; Fluids = hyponatremia due to inappropriate hypotonic intravenous fluid administration; NormoNa = normal plasma sodium levels following SAH.

