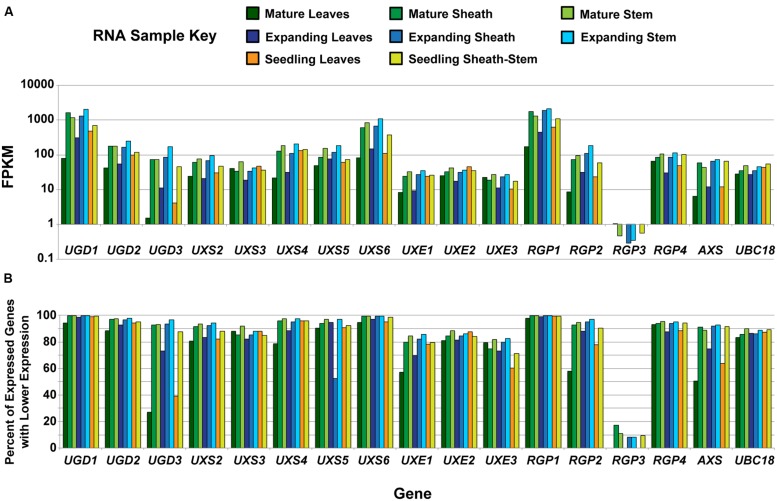
FIGURE 1.
Analysis of developmental expression of genes encoding UDP–sugar inter-conversion pathway enzymes in Brachypodium distachyon. (A) Analysis of RNA from tissues previously characterized in Rancour et al. (2012) by RNA-seq for genes encoding UDP–sugar inter-conversion pathway enzymes and the real-time PCR amplification control (UBC18). The samples represent a developmental series of distinct tissues. A key is given. Data are log base 10 scale of fragments per kilobase of transcript per million fragments mapped (FPKM). (B) Expression ranking for genes encoding UDP–sugar inter-conversion pathway enzymes and the real-time PCR amplification control. Ranking values represent the percent of expressed genes with FPKM values lower than the indicated gene for the given tissue. For RGP3, expression in leaf blades at all developmental stages was not detected.

