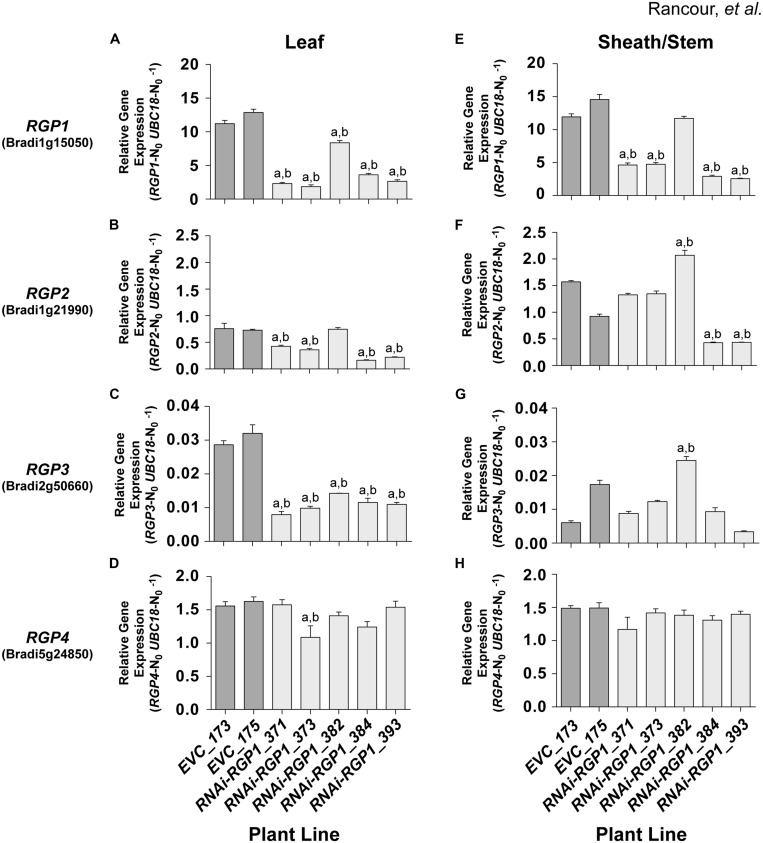
FIGURE 4.
RGP gene-family expression in RNAi and control lines. Real-time PCR analysis of RGP1 (A,E), RGP2 (B,F), RGP3 (C,G), and RGP4 (D,H) gene expression in transgenic B. distachyon Bd21-3 leaf blades (A–D) and leaf sheath/stem (E–H) fractions. Empty-vector control plant lines (EVC) 173 and 175, and RNAi-RGP1 lines 371, 373, 382, 384, and 393 data are presented. Error bars indicate SEM. a,b significantly different from EVC_173 and EVC_175 values, respectively (ANOVA with post hoc Tukey test, alpha = 0.01).

