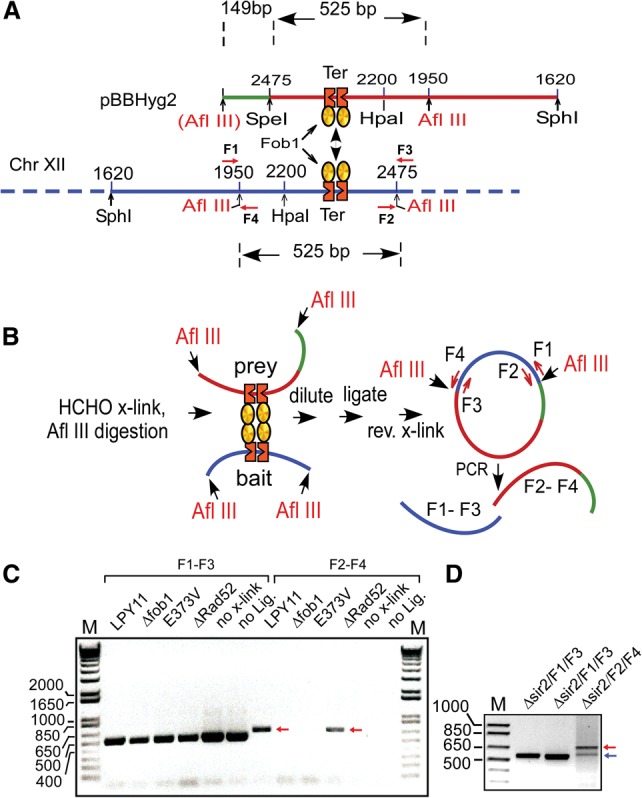
Figure 4.

A direct demonstration of Fob1-mediated chromosome kissing by 4C analyses. (A) Restriction maps of the plasmid-borne NTS1 region of rDNA showing the Ter sites and the naturally present left Afl III site (in red), the sequence tag (green) engineered to distinguish it from chromosomal NTS1 site (blue), and the engineered right Afl III site immediately to the right of the green tag. (B) Schematic representation of the 4C reaction and the primer pairs used for PCR amplification. (C) Agarose gel electrophoresis of the diagnostic PCR products indicative of chromosome kissing (red arrows) LPY11 contains Δsir2. (D) Agarose gel electrophoretic pattern showing both the PCR product caused by chromosomal rDNA Ter site interaction in trans with the plasmid-borne Ter site in trans (red arrow) and another chromosomal Ter site in cis (blue arrow).
