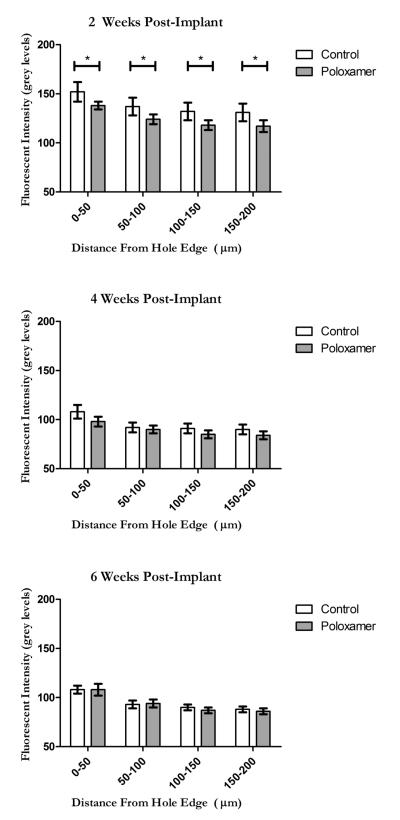
Figure 7.
GFAP fluorescent intensity profiles as measured from the edge of the explant site (Note that 0 is no longer the center of the hole as it was in the cell count analysis) at 2 weeks (TOP), 4 weeks (MIDDLE) and 6 weeks (BOTTOM). The y axis scale is reported in grey levels where 0 represents the grey level of normal tissue found far from the implant site. Significance is set at the Bonferroni corrected p < 0.004.

