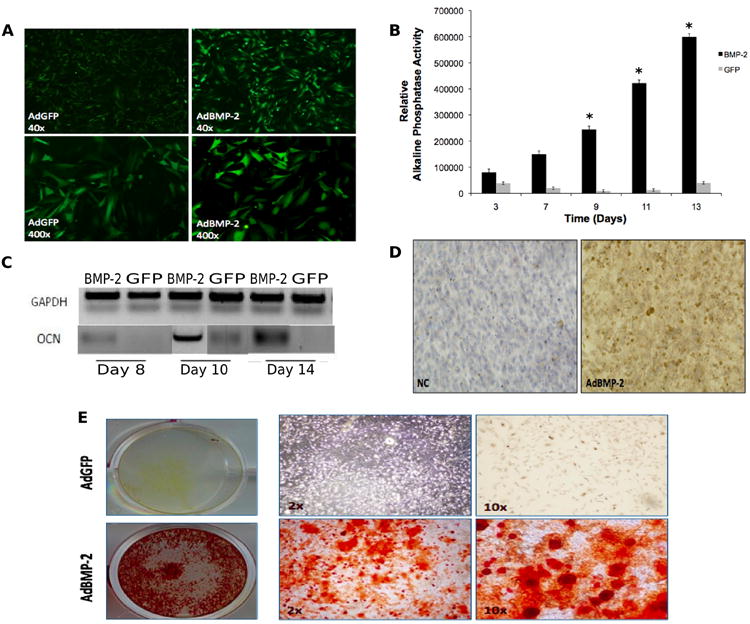
Figure 5. Detection of early and late markers of osteogenic differentiation.

A) Fluorescent microscopy imaging of green fluorescent protein (GFP) expression at 24 hours post-adenoviral infection of calvarial cells in GFP and BMP-2 groups. B) Average relative alkaline phosphatase activity in calvarial cells on days 3, 7, 9, 11 and 13 post-adenoviral infection with BMP-2 (black bars) or GFP alone (grey bars). Experiments were performed in triplicate. Error bars represent S.D. Asterisks denote statistical significance between AdBMP-2 versus AdGFP-treated cells. C) mRNA expression levels of osteocalcin in harvested calvarial cells on days 8, 10 and 14 post-adenoviral infection with BMP-2 or GFP (control). Internal control with GAPDH is also shown. D) Immunohistochemical staining for osteopontin in AdBMP-2 and negative control (NC) groups 10 days post adenoviral infection. E) Matrix mineralization (Alizarin red staining) on day 14 post infection in AdGFP-treated (top panel), and AdBMP-2-treated (bottom panel) cells.
