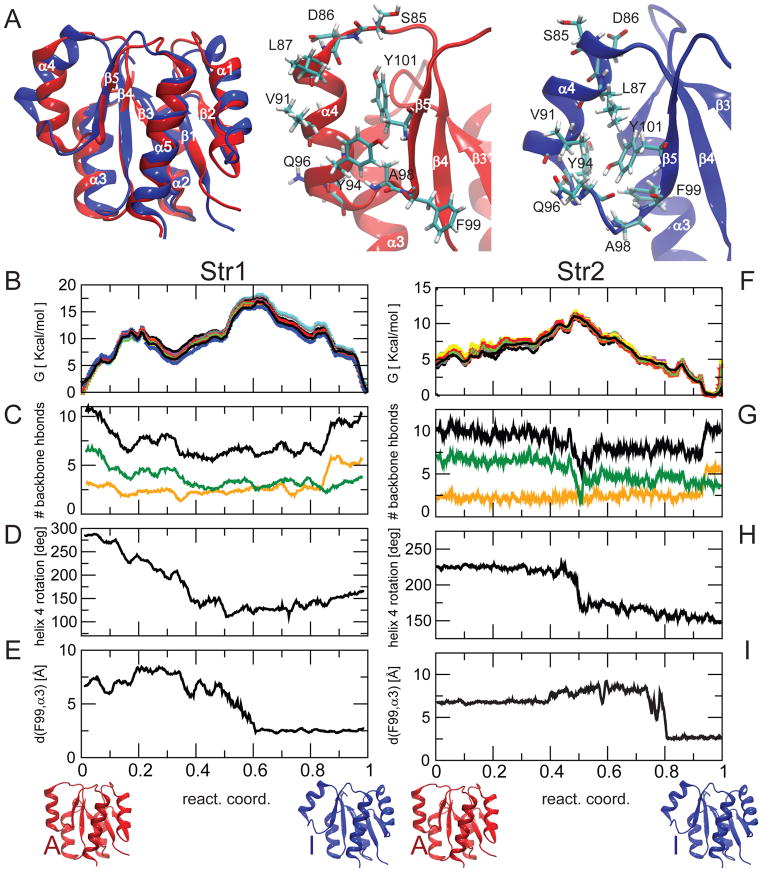
Fig. 1. Free energy landscape of active/inactive transition of NtrCR explored by the string method.
A) Inactive (blue) and active (red) models of NtrCR are overlaid and a zoom-in is shown highlighting the difference in conformation concentrated in the area of helix 4. The conformational change involves a different span of the helix in the sequence, a change in helix orientation, a rotation around the helical axis and a rearrangement of side-chains, including Y94, Q96, Y101.
B) Estimated free energy profile along the pathway for string 1; different profiles have been estimated repeating the weighted histogram analysis 10 times (shown in different colors), removing each time 10–20% of the data to provide an estimation of the uncertainties, (C) number of backbone H-bonds in helix 4 (black) and in the lower (residues 90–96, green) and upper part (residues 84–90, yellow) of helix 4, (D) rotation of helix 4 around its axis, (E) minimum distance of the side-chain of F99 from helix 3. (F–I) Similar plots for string Str2.

