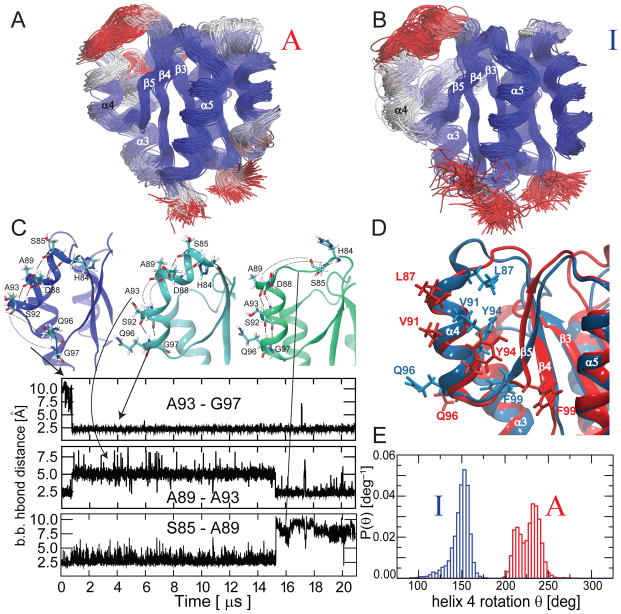
Fig. 4. Conformational sampling within the inactive and active states by long unbiased MD.
Overlay of structures sampled during 21 μs unbiased MD simulations initiated from the active (A) and inactive (B) models. The structures are colored from blue via grey to red according to the root mean squared fluctuations. C) Conformers with substantial differences in the α4 helical arrangement are sampled during the inactive state simulation. The changes in several i, i+4 backbone H-bonds in α4 during the MD run are depicted. D) Overlay of structures sampled respectively from the inactive state simulation (blue) and from the active state simulation (red). The secondary structure is almost overlapping; however, a crucial rotation of the α4 helix around its axis between the inactive and active conformer is observed, indicated by the arrangement of side-chains. E) The simulations starting from the inactive and active state sample distinct distributions of α4 helix orientations.

