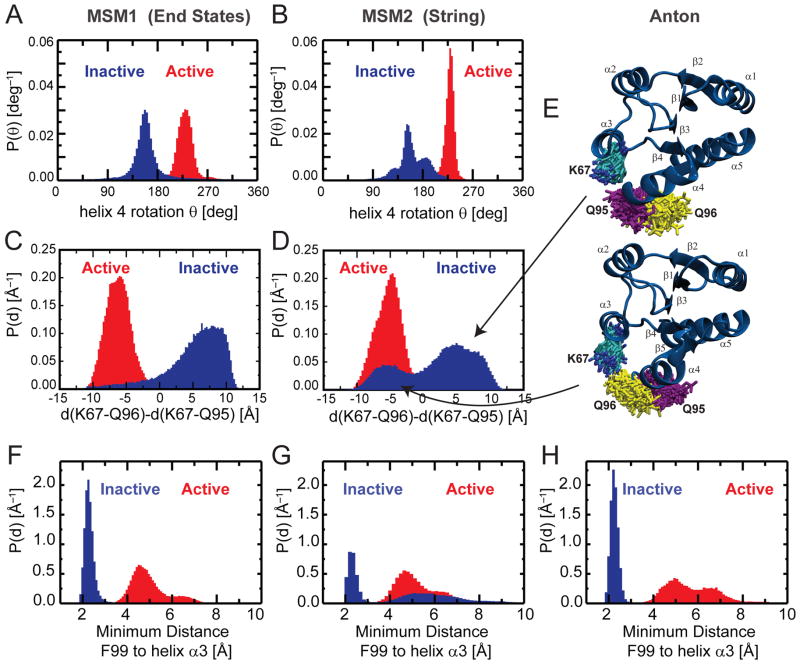
Fig. 6. Comparison between different MSM analyses.
The distributions of some relevant order parameters highlight similarities and differences between the results presented by Vanatta et al.42 (MSM1), obtained by simulation initiated from the active and inactive end states using the force field Amber99SB, and that of the present study (MSM2) obtained by simulations initiated from structures along the string pathway Str2 (see Fig. 1) using the force field Charmm27.
A,B) The rotation of helix 4 around its axis can separate active and inactive states in both studies. C–E) The distribution of the distance between K67 and the glutamine residues Q95 and Q96 highlights the larger degree of heterogeneity of I observed in MSM2 (D), with respect to MSM1 (C). The same heterogeneity for the Q95/Q96 orientation is observed in unbiased inactive states simulations performed on Anton, shown by structural snapshots (E).
F–H) Position of F99 relative to helix3 for MSM1 (F), MSM 2 (G) and from the Anton run (H).

